Certification: Looker Business Analyst
Certification Full Name: Looker Business Analyst
Certification Provider: Google
Exam Code: Looker Business Analyst
Exam Name: Looker Business Analyst
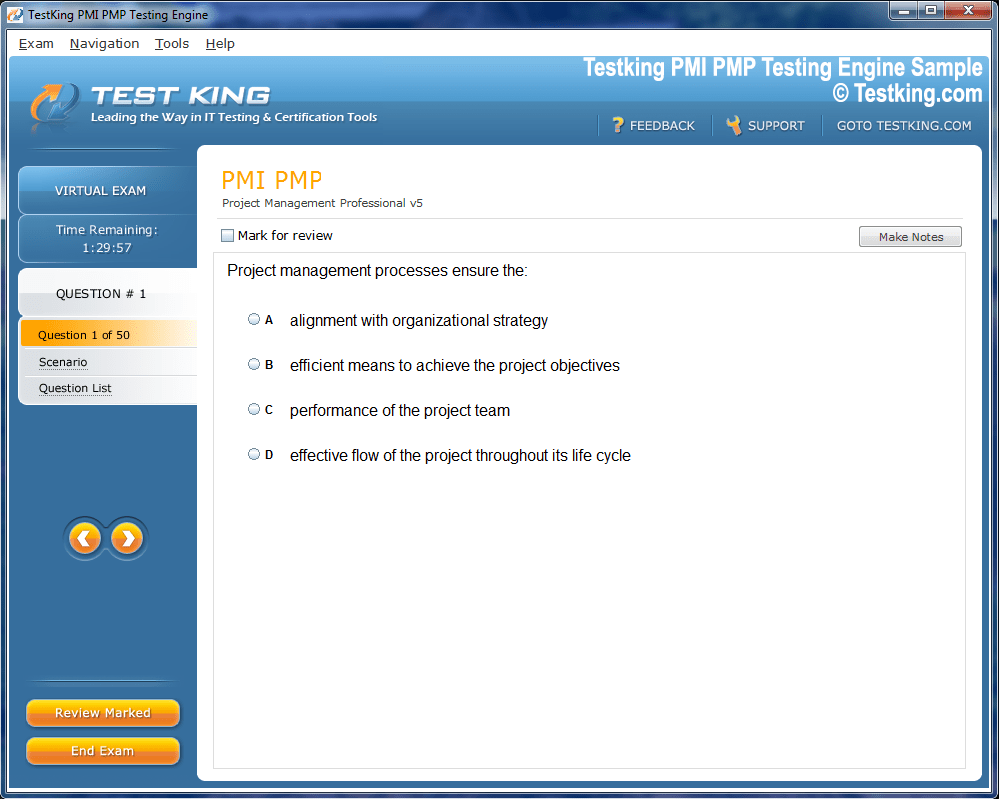
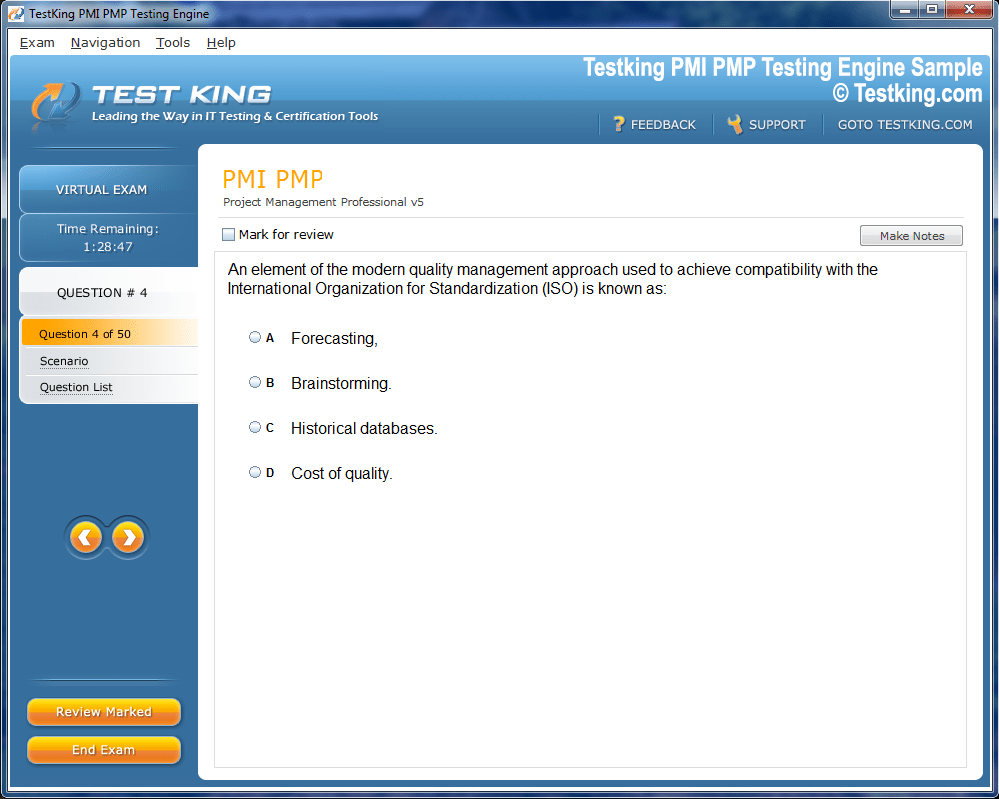
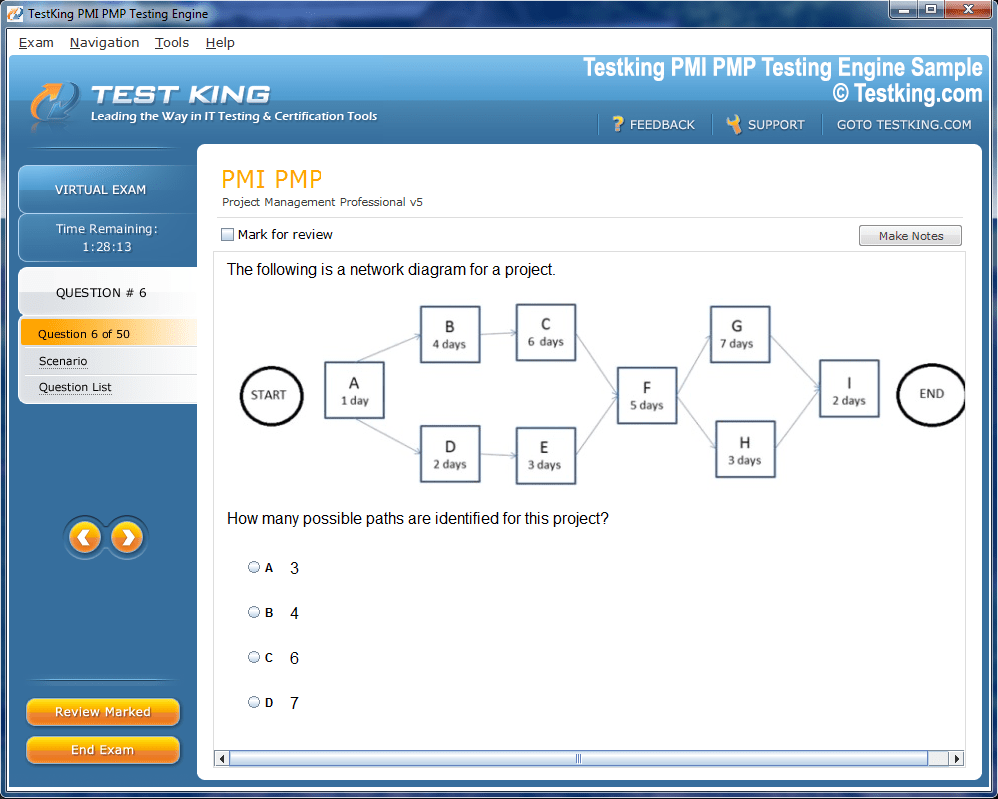
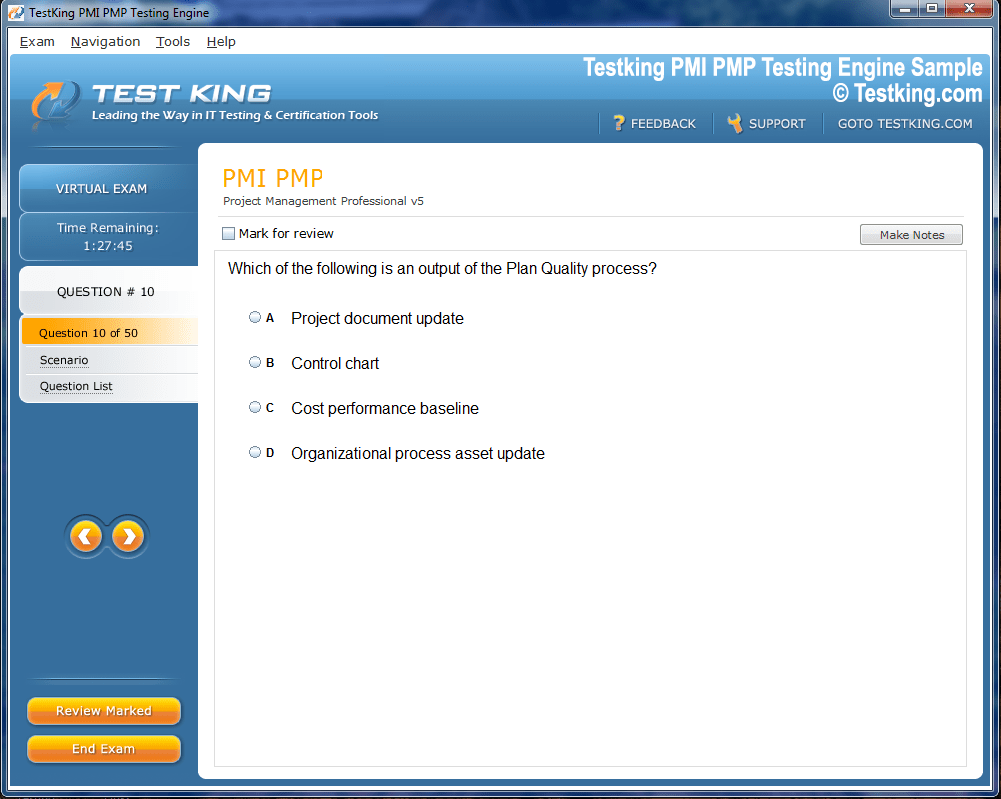
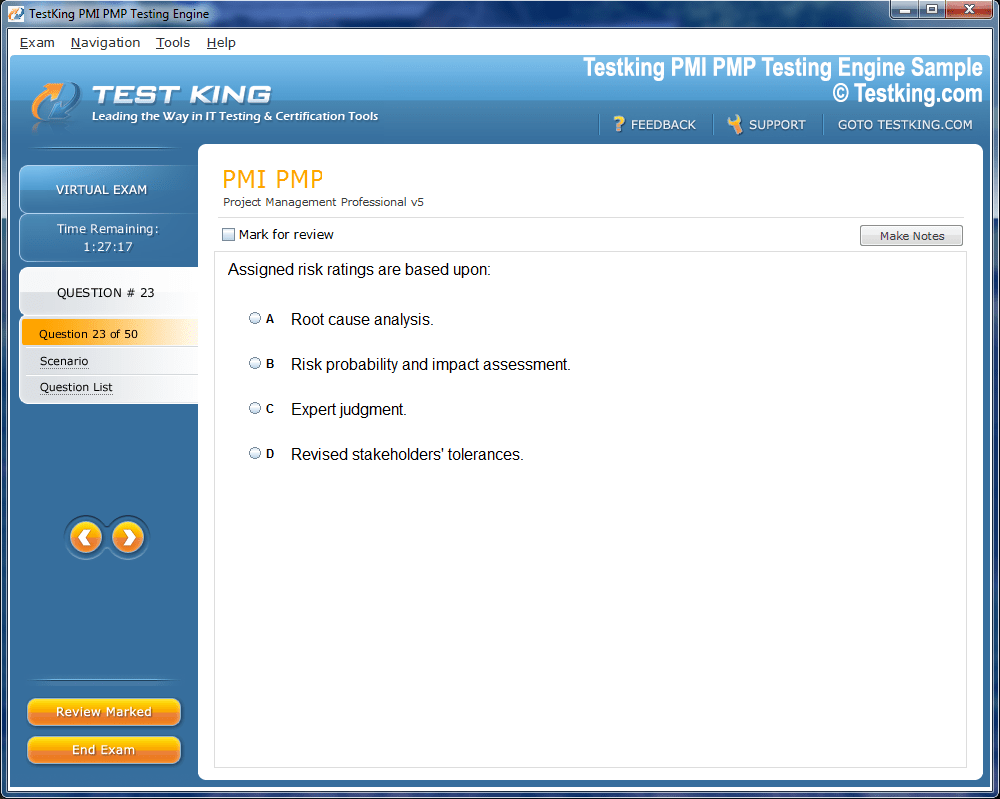
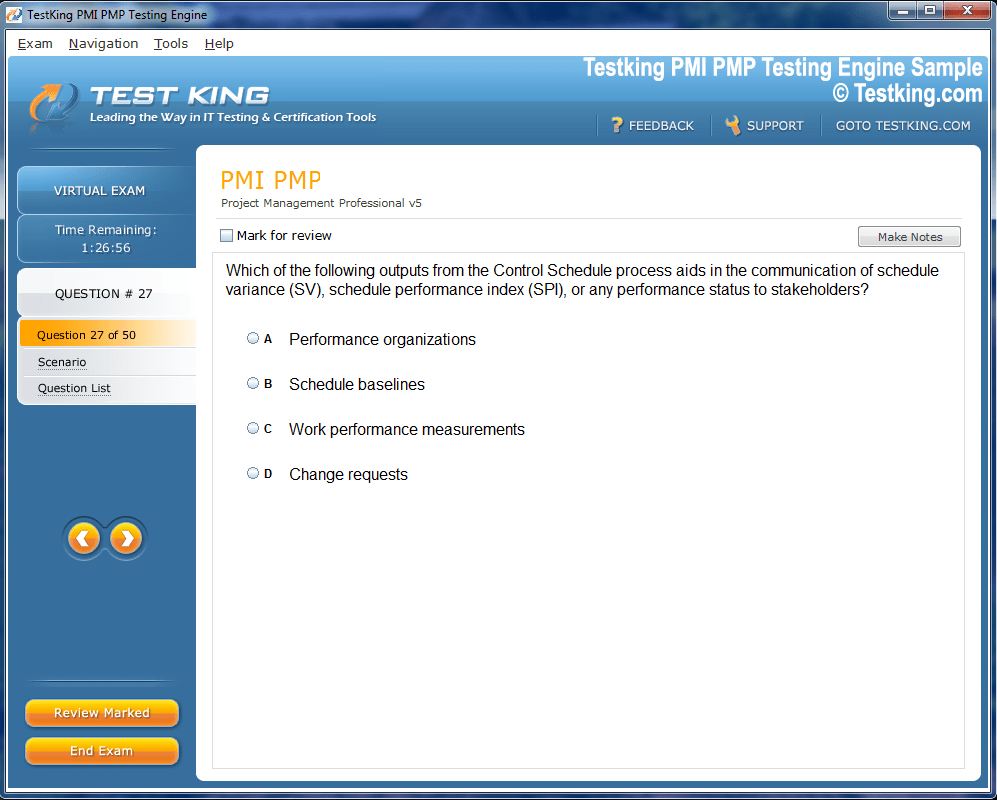
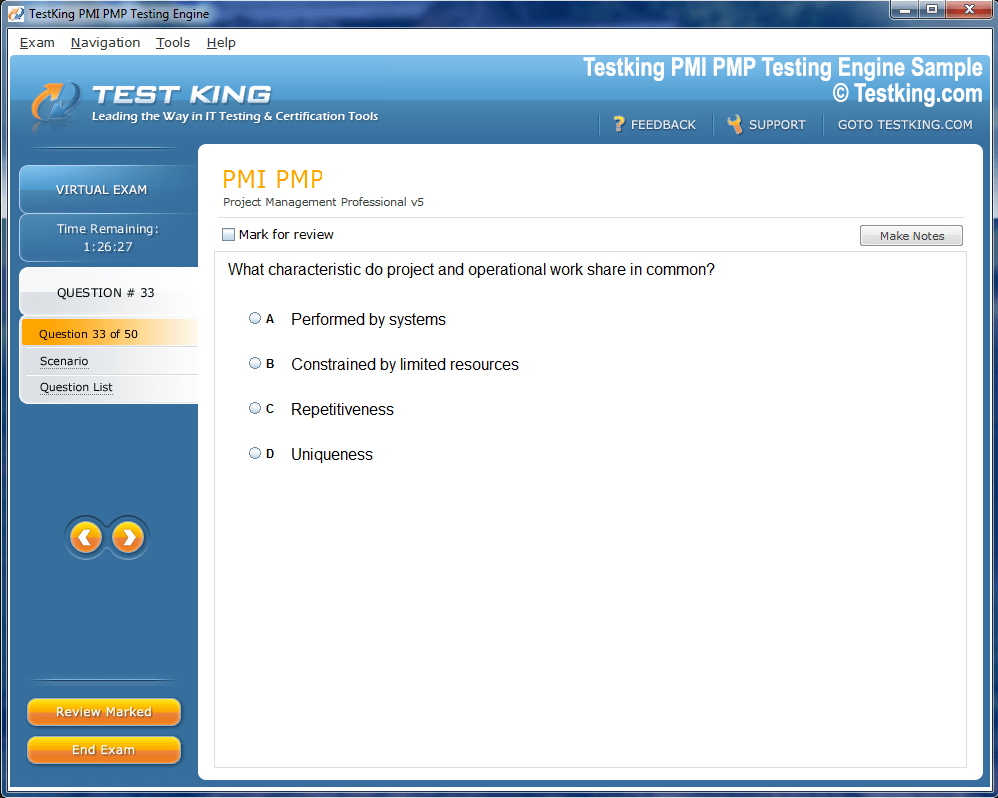
Product Screenshots
nop-1e =1
Advanced Techniques for Achieving Looker Business Analyst Certification
Looker operates as a powerful bridge between complex data infrastructures and the professionals who rely on visual representations to make informed decisions. It serves as a unified layer that abstracts database intricacies, enabling users to interact with data through dashboards, visual charts, and analytical reports. Instead of writing SQL queries, users navigate a graphical interface where metrics and dimensions are predefined through LookML, Looker’s proprietary modeling language.
LookML plays an essential role by translating database structures into logical data models that define relationships, metrics, and hierarchies. This modeling approach allows organizations to maintain uniform analytical definitions while empowering users to explore datasets independently. The result is a seamless balance between governance and flexibility, ensuring consistency across departments without restricting analytical creativity.
Evolution and Integration within Google Cloud
Google’s acquisition of Looker in 2019 marked a significant milestone in the evolution of data analytics. Since then, Looker has become deeply intertwined with the broader Google Cloud ecosystem, creating a unified platform that connects data warehousing, modeling, and visualization. Its integration complements products like BigQuery, enabling faster and more scalable data operations while maintaining transparency between cloud storage and analytical insights.
This integration has transformed Looker from an independent analytics platform into an essential component of Google’s data intelligence strategy. For professionals in data analytics, this connection amplifies the importance of mastering LookML and understanding how Looker fits within the modern cloud data stack.
Defining the LookML Developer Role
The LookML Developer is the architect of Looker’s analytical framework. This role involves designing, maintaining, and optimizing LookML models that govern how data is accessed and presented. Developers define views, measures, and explores—each forming the backbone of Looker’s data exploration experience. Their work ensures that business users can generate dashboards and visualizations with clarity and accuracy, free from the constraints of raw query writing.
Beyond coding, the role requires a deep comprehension of data structures, performance optimization, and analytical intent. The LookML Developer must balance precision and accessibility—crafting models that are both technically sound and intuitive for non-technical users.
Significance of the LookML Developer Certification
The LookML Developer Certification offered by Google Cloud validates the capability to design, implement, and maintain high-quality LookML models. It assesses a candidate’s ability to transform business requirements into structured data representations, applying principles of performance, governance, and usability. The certification’s rigor reflects the growing need for professionals who can bridge the divide between technical engineering and analytical storytelling.
While some certifications cover multiple tools and services, this one focuses solely on Looker and its modeling ecosystem. This singular concentration allows for an in-depth evaluation of proficiency, rewarding those who demonstrate both technical dexterity and conceptual insight.
The Transition from Looker Business Analyst Certification
The earlier Looker Business Analyst Certification once catered to non-technical professionals who used Looker primarily for visualization and reporting. However, as the analytics landscape matured, the emphasis shifted toward modeling and architecture. Google’s consolidation of certifications under the Cloud brand resulted in the discontinuation of that program, placing greater weight on the LookML Developer pathway.
This shift reflects an industry-wide trend toward empowering professionals who can understand both the analytical and structural dimensions of data. While the Business Analyst certification focused on interpreting and displaying information, the LookML Developer certification centers on creating the underlying systems that make that interpretation possible.
The Motivation for Pursuing the Certification
Learning Looker and obtaining the LookML Developer certification represents more than a professional milestone—it symbolizes a commitment to mastering the analytical backbone of modern organizations. Data visualization and storytelling have become indispensable to strategic decision-making, and those who understand the architecture behind these insights gain a significant advantage.
The motivation for pursuing certification often stems from the desire to deepen one’s understanding of the data pipeline—from ingestion to modeling to presentation. As Google Cloud continues to weave Looker more tightly into its ecosystem, the certification serves as a benchmark for professionals seeking to establish credibility in cloud analytics and business intelligence.
The Starting Point in the Learning Journey
For those beginning their Looker journey, familiarity with SQL and foundational data concepts provides an advantage. However, Looker introduces unique paradigms and terminologies that require dedicated study. Concepts such as views, explores, measures, and datagroups may appear straightforward but demand contextual understanding to apply effectively.
Beginners often experience a period of adjustment as they reconcile LookML’s declarative syntax with procedural programming habits. Unlike conventional scripting, LookML defines what data should represent rather than how it should be retrieved. This philosophical shift necessitates patience and practice, particularly when translating business logic into data models.
Overcoming Early Challenges
Initial exposure to Looker can be disorienting due to its distinctive nomenclature and design patterns. Parameters like “timeframes” and “intervals” may seem inconsistent, while terminology such as “looks” or “datagroups” deviates from traditional analytics vocabulary. Understanding the logic behind these constructs requires exploring how Looker structures its abstraction layer to maintain flexibility while ensuring standardized modeling.
Beginners may also encounter difficulty distinguishing between views and explorers. Every exploration originates from a base view, but recognizing how these components interact takes time. Once this relationship becomes intuitive, developers gain confidence in constructing cohesive models that mirror real-world business processes.
The Time Investment Required
Achieving fluency in LookML typically demands several months of consistent study and experimentation. The learning curve arises not from technical complexity but from conceptual subtlety. Developers must internalize how models, joins, and dimensions interact, as well as how minor syntax changes can alter analytical outcomes.
Practical experience is invaluable. Working within sandbox environments, experimenting with model structures, and simulating business scenarios accelerate understanding. Each iterative improvement deepens comprehension, transforming abstract principles into applied expertise.
The Intellectual Reward
Despite the initial challenges, mastering Looker yields immense intellectual and professional satisfaction. The ability to translate business questions into dynamic data models empowers developers to act as both engineers and strategists. Their work facilitates insight generation across departments, driving data-informed decisions that enhance organizational performance.
Looker’s modeling language, though initially intricate, offers elegance through structure and reusability. Once learned, it allows developers to create scalable frameworks that adapt effortlessly to evolving business requirements. The journey from confusion to fluency mirrors the evolution of data itself—complex at first glance, yet coherent when observed through the right lens.
Initial Steps in Exploring Looker
Embarking on the journey of understanding Looker requires a patient and deliberate approach, particularly for individuals approaching it from a traditional data engineering or software development background. Unlike conventional analytics tools that offer intuitive drag-and-drop interfaces or prescriptive workflows, Looker introduces a distinctive layer of abstraction between the raw data and the end-user visualizations. This layer, realized through the Looker Modeling Language, enables a more meticulous and governed approach to defining data structures. LookML, the language underpinning Looker’s data models, is not inherently related to machine learning nor does it derive from markup paradigms; instead, it constitutes a semantically rich specification language that defines how raw data is transformed, aggregated, and presented.
The first encounter with Looker often involves navigating its terminology. Objects such as explorers, views, and looks carry specific meanings that do not always correspond with the nomenclature found in other analytics or visualization tools. An explorer, for instance, represents a starting point for data exploration, which itself is underpinned by a view that organizes the data fields and dimensions. The naming convention may appear arcane initially, but it reflects Looker’s philosophy of modularity and reusability, where each view can be leveraged across multiple explorers to ensure consistency and maintainability.
Understanding the architecture requires a mental shift: Looker is not merely a visualization interface but a framework for encapsulating data logic. Business analysts interact with dashboards and charts, but their underlying structure is defined by LookML developers who translate database schemas into reusable data constructs. This division of labor ensures that analysts are insulated from the complexities of SQL while still providing robust flexibility in exploring data. The abstraction facilitates governance and consistency, enabling organizations to maintain standardized definitions for metrics and dimensions across departments.
The Complexity of Terminology
A significant challenge for newcomers lies in mastering the terminology. At first glance, the words “look,” “view,” and “explore” can be bewildering, especially when compared with more conventional terms like report, chart, or table. A look represents a preconfigured visualization or report, encapsulating queries and layout choices in a reusable form. The choice of terminology may feel idiosyncratic, but it aligns with Looker’s brand identity and internal conceptual framework. Similarly, datagroups define caching policies, a vital performance optimization tool that ensures frequently accessed data is efficiently retrieved without repeatedly querying the underlying database. The abstraction of caching strategies into datagroups may seem opaque at first, yet it provides a centralized mechanism for controlling freshness, persistence, and query execution across multiple models.
Another layer of complexity emerges from the inconsistent parameter naming. Time-based splits, for example, use the “timeframes” parameter, while duration-based splits use “intervals.” Accessing derived fields such as hours may involve different syntactic references depending on the type of split: one might use ${created_hour} for a time split but ${hours_created} for a duration split. These variations require careful attention and memorization, which can initially be a source of frustration for learners attempting to build confidence in LookML syntax. The idiosyncrasies extend to filtering mechanisms, access controls, and join relationships, each carrying nuanced rules that influence both query behavior and performance outcomes.
Learning Curve and Initial Practice
The learning curve for Looker can be steeper than anticipated, particularly for those accustomed to more visually guided analytics tools. Familiarity with SQL and data visualization principles provides an advantage, yet the transition from raw code to LookML’s declarative modeling paradigm demands sustained effort. Early exercises often involve constructing views from existing queries, defining dimensions and measures, and configuring explorers for user-facing consumption. These foundational tasks underscore the importance of precision, as minor syntactic or semantic errors can propagate across the data model, affecting multiple downstream reports and dashboards.
Practical engagement with the tool, rather than theoretical study alone, proves essential. Sandbox environments or isolated Looker instances allow for experimentation with view creation, explore configuration, and datagroup management. These environments enable the testing of performance tuning strategies, such as leveraging persistent derived tables to minimize query latency or customizing SQL to optimize join operations. Experiential learning in these controlled settings allows for iterative refinement, fostering a deeper comprehension of LookML constructs and their operational implications.
Structuring Views and Explores
A core competency in LookML development involves the thoughtful structuring of views and explores. Views act as modular representations of database tables or query results, encapsulating fields, measures, and dimensions in a reusable format. Explores build upon these views, offering users curated entry points for interactive analysis. The relationship between views and explorers requires careful planning, as each explorer inherits the fields and relationships defined within its associated view. Misalignment or inconsistency at this level can result in inaccurate metrics, broken dashboards, or confusing user experiences.
Designing a robust data model involves balancing granularity, usability, and performance. Measures must accurately reflect business logic, dimensions should facilitate meaningful segmentation, and joins must be structured to avoid redundant or excessive queries. The declarative nature of LookML encourages a principled approach, where each object is explicitly defined and relationships are systematically articulated. This design philosophy contrasts with more heuristic approaches, offering clarity and maintainability at scale but necessitating meticulous attention to detail.
Performance Optimization
Performance considerations are central to effective LookML development. Datagroups, persistent derived tables, and carefully constructed joins collectively influence query efficiency. Datagroups allow developers to specify caching durations, dependency structures, and triggers for data refreshes, minimizing unnecessary load on the database. Persistent derived tables precompute complex aggregations, reducing real-time computation demands during user interaction. Meanwhile, optimized joins ensure that relational data is retrieved without redundancy, maintaining both speed and accuracy.
The nuances of performance tuning in Looker require an understanding of underlying database behavior. Query execution patterns, indexing strategies, and table cardinality all influence how LookML constructs translate into SQL and, consequently, affect runtime efficiency. Developers must cultivate a dual perspective: one that considers the logical correctness of the data model and another that evaluates operational efficiency. This duality underscores the sophistication of Looker as a platform that integrates both semantic modeling and performance engineering.
Git Integration and Collaboration
Version control is an indispensable aspect of LookML development. Looker integrates with Git to facilitate collaborative model development, branch management, and conflict resolution. Developers working on multiple features or experiments can leverage branches to isolate changes and perform iterative testing without impacting production dashboards. Pull requests and merge workflows provide structured mechanisms for code review, ensuring adherence to organizational standards and preventing inadvertent disruptions to user-facing analytics.
Conflict resolution in Git requires attentiveness, particularly when multiple developers modify overlapping components. The declarative structure of LookML means that even minor edits to dimensions or measures can have cascading effects, necessitating careful review and testing. By embedding version control practices into the development workflow, organizations enhance both reliability and transparency, enabling iterative improvements while maintaining consistent user experiences.
Debugging and Validation
Debugging LookML models is a fundamental skill for ensuring data accuracy and operational stability. Looker offers built-in validation tools, such as the Content Validator, which systematically checks the integrity of views, explorers, and dashboards. Error messages often provide insights into syntax errors, missing references, or misaligned relationships, yet interpreting these messages requires familiarity with LookML’s structure and conventions. Community discussions and shared knowledge repositories further supplement debugging efforts, offering practical strategies for resolving common issues encountered during model development.
Proficiency in debugging extends beyond resolving syntax errors. Developers must anticipate potential edge cases, such as null values, duplicated records, or unexpected join behaviors, which can compromise analytical outputs. This proactive mindset, combined with systematic testing, ensures that dashboards and reports consistently deliver accurate insights to end-users.
Filters and Access Controls
Implementing appropriate filters and access controls is another critical component of LookML development. Filters, including access filters, sql_always_where conditions, and conditional filters, regulate the data visible to specific users or groups. Access grants further restrict data exposure based on role definitions, ensuring that sensitive information is only accessible to authorized individuals. Mastery of these mechanisms enables developers to enforce data governance policies while maintaining usability for analysts and decision-makers.
The application of filters is nuanced and context-dependent. Choosing the appropriate filter type requires understanding user requirements, database behavior, and performance implications. Misconfigured filters can lead to incomplete datasets, incorrect aggregations, or performance bottlenecks, highlighting the importance of deliberate and informed implementation.
Handling Derived Tables
Derived tables, both SQL-based and native, provide mechanisms for precomputing and structuring complex queries within Looker. Persistent derived tables are particularly valuable for enhancing performance, as they reduce the need for repetitive computation during real-time exploration. Developers must determine when to use derived tables versus dynamic queries, balancing storage costs, query latency, and data freshness.
Understanding derived tables involves both syntactic proficiency and conceptual clarity. Developers must define primary keys, manage field references across multiple views, and ensure that aggregation logic aligns with business requirements. Misalignment at this stage can propagate inconsistencies throughout the data model, underscoring the precision required in LookML development.
Exam Preparation Considerations
The LookML Developer certification is highly focused in scope, concentrating on the practical application of LookML rather than broader cloud concepts. While this limited scope simplifies preparation in one sense, it also demands familiarity with detailed syntax, parameters, and edge cases. Unlike broader certifications that evaluate multiple products and features, the LookML exam tests mastery of a singular, intricate domain.
Effective preparation involves combining hands-on practice with structured study of documentation and conceptual frameworks. Sandbox exercises, practice questions, and scenario-based problem-solving help reinforce understanding and build confidence. Given the emphasis on syntactic precision and logical reasoning, repeated practice with LookML constructs, joins, filters, and derived tables is essential.
Summary of Core Competencies
In sum, proficiency in LookML development requires expertise across multiple dimensions: constructing modular views, configuring explores, optimizing performance, implementing filters and access controls, integrating with version control systems, debugging errors, and managing derived tables. Each competency builds upon foundational knowledge, emphasizing meticulous attention to detail, logical rigor, and operational awareness.
Achieving fluency in LookML is not merely an exercise in syntax memorization; it entails cultivating a holistic understanding of how data is modeled, queried, and presented. Developers must anticipate user interactions, enforce governance policies, and optimize performance simultaneously. This multifaceted skill set underpins the value of the LookML Developer certification, reflecting both the technical complexity and strategic significance of Looker in contemporary analytics environments.
Navigating the Looker Interface
Mastering Looker begins with understanding its interface, which, although deceptively simple, conceals layers of structural and functional complexity. Users primarily interact with dashboards and visualizations, while LookML developers operate behind the scenes, defining the underlying models that give these visualizations coherence and reliability. The interface offers several entry points for exploration: preconfigured looks, user-generated dashboards, and the explore environment. Each element functions as an access point to the underlying data, but the efficacy of these interactions depends on the rigor and precision of the LookML definitions beneath them.
A look is a pre-built visualization or report, capturing specific queries and their visual arrangements. While the term may initially seem non-intuitive, it reflects Looker’s conceptual framework, where each look is a reusable object that can be referenced across multiple dashboards or embedded within other analytics contexts. This modularity allows organizations to maintain consistency across reporting structures, ensuring that repeated metrics or dimensions retain uniform definitions. Despite its apparent simplicity, constructing a look that is both accurate and performant requires careful attention to the underlying data model and query structure.
Conceptualizing Views
Views are the fundamental building blocks within Looker. Each view represents a collection of fields derived from a database table or query and encapsulates dimensions, measures, and relationships. The purpose of a view is to provide a reusable, logically coherent abstraction of data that can be referenced across multiple explores. Views enable developers to impose structure on otherwise unorganized datasets, ensuring that end-users interact with data in a meaningful and controlled manner.
Constructing a view involves defining dimensions, which correspond to categorical fields, and measures, which perform aggregations or computations. The declarative syntax of LookML allows developers to articulate both the type of aggregation and the SQL expression underlying it. This approach emphasizes clarity and maintainability, allowing future developers to comprehend and extend models without reconstructing the logic from scratch. The discipline of building robust views fosters a deep understanding of both the data itself and the business logic that governs its interpretation.
The Role of Explores
Explores serve as the user-facing interface for analysis, leveraging the definitions contained in underlying views. Each explorer can be thought of as a curated sandbox, providing analysts with a guided entry point for querying data. Explorers inherit the fields, measures, and relationships from associated views, but developers can further tailor them by defining join relationships, filters, and default aggregations.
The complexity of an exploration often reflects the intricacies of the business requirements it serves. For instance, an explorer designed for sales analytics may integrate multiple views, including customer, order, and product tables, requiring precise join conditions to ensure accuracy. Misconfigured joins can produce inflated counts, incorrect aggregations, or inconsistent filtering, highlighting the importance of rigorous attention to detail in LookML development.
Filtering and Access Control
Filters are essential tools for controlling which data is visible in a given explorer or dashboard. They allow developers to define constraints that restrict query results based on user requirements, performance considerations, or governance policies. LookML provides several types of filters, including access filters, sql_always_where conditions, and conditional filters, each with specific use cases. Access filters are particularly valuable for enforcing row-level security, ensuring that sensitive data is only visible to authorized users.
Access grants further refine this control, allowing developers to define granular visibility rules based on roles or group memberships. The interplay between filters and access grants requires careful planning, as incorrect configuration can lead to incomplete datasets, data leaks, or performance inefficiencies. Mastery of these mechanisms ensures that users can explore data safely and efficiently while maintaining compliance with organizational policies.
Derived Tables and Persistent Tables
Derived tables provide a mechanism for precomputing complex queries within Looker. These tables, defined either as SQL or native LookML constructs, allow developers to encapsulate aggregations, transformations, and join operations in reusable structures. Persistent derived tables, in particular, enhance performance by storing precomputed results, reducing the need for repeated computation during live queries.
Deciding when to use a derived table versus a dynamic query requires careful consideration of both performance and storage implications. Derived tables increase storage demands but can dramatically reduce runtime query complexity, particularly for highly aggregated or frequently accessed data. Developers must also ensure that primary keys are appropriately defined and that relationships between derived tables and other views maintain referential integrity. This balance of efficiency, accuracy, and maintainability underscores the nuanced judgment required in LookML development.
Performance Considerations
Optimizing performance in Looker involves multiple strategies, including the judicious use of datagroups, persistent derived tables, and well-structured joins. Datagroups allow developers to define caching policies, specifying refresh intervals, dependencies, and triggers. By reducing repeated database queries, datagroups improve the responsiveness of dashboards and explorations while preserving data accuracy.
Persistent derived tables complement this approach by precomputing resource-intensive queries. Developers must carefully consider which aggregations, joins, or transformations merit persistence, as indiscriminate use can lead to unnecessary storage consumption. Join structures also impact performance; redundant joins or improperly indexed fields can slow queries, highlighting the importance of understanding the underlying database schema and execution plans. Achieving optimal performance requires a dual focus: conceptual correctness and operational efficiency.
Git Integration for Collaborative Development
Collaboration is an integral aspect of LookML development, particularly in organizations with multiple analysts or developers. Git integration provides a robust framework for version control, branch management, and conflict resolution. Developers can create isolated branches to experiment with new models or modifications without affecting production dashboards, enabling iterative development and testing.
Pull requests and merge workflows introduce a structured review process, ensuring that changes adhere to organizational standards and maintain data integrity. Conflicts, particularly when multiple developers modify overlapping objects, require careful resolution to prevent inconsistencies or broken functionality. Version control practices foster transparency, traceability, and accountability, essential components of a professional analytics development environment.
Debugging LookML Models
Debugging is a critical skill in LookML development. Looker provides validation tools, such as the Content Validator, to identify errors in syntax, missing references, or misaligned relationships. Error messages may require interpretation, as the underlying issue is not always immediately evident. Developing familiarity with common error patterns and solutions accelerates the debugging process.
Beyond syntax errors, developers must anticipate logical inconsistencies, such as null value propagation, duplicated records, or unintended join behaviors. Rigorous testing and scenario analysis help ensure that dashboards and reports remain accurate and reliable. Debugging also reinforces understanding of the data model, exposing subtle dependencies and interactions that inform more sophisticated design choices.
Scenario-Based Problem Solving
Scenario-based exercises provide a practical method for consolidating LookML knowledge. By simulating real-world analytics tasks, developers gain insight into how different constructs interact and how changes in one part of the model affect others. Scenarios might include calculating customer retention over time, segmenting sales by region, or deriving complex metrics across multiple tables.
These exercises cultivate critical thinking, enabling developers to translate abstract business requirements into precise LookML constructs. Scenario practice also strengthens familiarity with syntax, joins, filters, and performance optimization techniques, providing a comprehensive preparation framework for both practical development and certification assessments.
Exam Preparation Strategies
Preparing for the LookML Developer certification requires a methodical approach. Unlike broader cloud certifications, the exam focuses narrowly on LookML constructs, syntax, and best practices. Success depends on both conceptual understanding and meticulous attention to detail. Hands-on practice in sandbox environments or isolated instances is invaluable, allowing learners to construct views, explorers, filters, and derived tables.
Creating personal practice questions and simulating exam scenarios enhances readiness. Given the exam’s emphasis on unformatted code and scenario-based questions, developers benefit from repeated exposure to complex, multi-line LookML blocks. Practicing error detection, syntax validation, and code comparison fosters proficiency and builds confidence for the timed assessment.
Mastering Syntax and Edge Cases
The LookML exam emphasizes mastery of syntax and edge cases, necessitating familiarity with parameter names, object definitions, and nuanced behaviors. Even experienced developers may find this challenging, as inconsistencies in naming conventions and code presentation can obscure intended functionality. For example, distinguishing between timeframes and intervals, or interpreting derived field references, requires precision and attentiveness.
Proficiency in these edge cases enhances both exam performance and real-world development. Understanding subtle distinctions between object types, filters, and joins allows developers to construct robust, maintainable models that accurately reflect business requirements. Attention to detail in syntax and semantics is a hallmark of effective LookML development.
Performance and Optimization in Depth
Beyond basic usage, advanced LookML development demands a deep understanding of performance optimization. Developers must consider query execution plans, indexing, and the cardinality of tables when designing views and explorations. Complex joins, particularly across multiple tables or derived tables, can introduce latency if not carefully structured.
Persistent derived tables and datagroups mitigate performance concerns, but their implementation requires strategic judgment. Balancing the benefits of precomputed results against storage and refresh costs is a recurring consideration. Developers must also account for database-specific behaviors, ensuring that LookML constructs translate efficiently into SQL and execute predictably under varied workloads.
Integration with Business Workflows
Looker is not an isolated tool; its value emerges when integrated into broader business workflows. Analysts rely on dashboards and explorers for decision-making, but the integrity of these outputs hinges on LookML developers’ diligence. Models must be designed with both current and future business needs in mind, anticipating changes in data structure, reporting requirements, and performance expectations.
Effective integration requires collaboration between developers and analysts. Communicating assumptions, constraints, and limitations ensures that dashboards meet user expectations while maintaining technical robustness. This interplay underscores the dual responsibility of LookML developers: to enforce data governance and to enable actionable, reliable insights.
The Intricacies of LookML Syntax
A defining characteristic of LookML is its declarative syntax, which enables developers to articulate data models with precision. Unlike procedural SQL, LookML focuses on the “what” rather than the “how,” allowing the underlying engine to determine execution specifics. Dimensions, measures, and joins are specified with explicit parameters, reflecting both business logic and database relationships. While this abstraction simplifies end-user interaction, it demands rigorous attention from developers, as minor inconsistencies or misconfigurations can propagate errors across multiple reports and dashboards.
The syntactical landscape of LookML can initially appear labyrinthine. Objects such as views, explorers, and derived tables follow specific hierarchical conventions, while parameters governing aggregation, filtering, and visibility often exhibit subtle idiosyncrasies. For instance, the method for referencing a derived field varies depending on whether it is part of a time-based or duration-based split. These nuances require sustained engagement and iterative practice to internalize, highlighting the importance of deliberate, hands-on learning.
Advanced View Design
Beyond foundational views, advanced LookML development entails constructing complex, reusable objects capable of supporting multifaceted analyses. Views must encapsulate accurate measures, logically coherent dimensions, and robust relationships to other tables or derived constructs. The modular nature of views encourages reusability, allowing a single view to serve multiple explorers and dashboards without redundancy.
Advanced design also considers performance implications. Developers must evaluate the cardinality of fields, optimize joins to minimize query load, and decide when to utilize persistent derived tables. Thoughtful structuring of views ensures that the resulting models are both performant and maintainable, providing a foundation for scalable, enterprise-grade analytics.
Complex Explores
Explores serve as curated entry points for data analysis, enabling users to interact with underlying views in a controlled and meaningful manner. Complex explorers often integrate multiple views, requiring precise join definitions, appropriate filtering, and well-structured aggregations. Misalignment at this level can lead to misleading results, such as inflated counts or incomplete aggregations, emphasizing the importance of meticulous configuration.
Advanced explorers also leverage conditional parameters and access filters to tailor user experiences. Developers can create dynamic exploration environments, where the visibility of fields and the availability of metrics adapt based on user roles, permissions, or contextual requirements. This flexibility enhances the utility of the analytics platform while preserving governance and security.
Filters and Conditional Logic
Filters in LookML serve as essential instruments for refining queries and ensuring data security. They range from static constraints to dynamic, context-sensitive rules that adjust based on user inputs or other parameters. Access filters, sql_always_where conditions, and conditional filters enable developers to enforce nuanced controls over the data presented in explorers or dashboards.
Conditional logic within LookML allows for adaptive behavior, such as modifying the dataset based on role membership, time ranges, or other criteria. Implementing these features requires both syntactical mastery and a deep understanding of business requirements, as improper configuration can result in inaccurate or incomplete outputs.
Persistent Derived Tables and Optimization
Persistent derived tables are a cornerstone of high-performance LookML development. By precomputing frequently accessed or computationally intensive queries, these tables reduce runtime load and improve responsiveness. Developers must carefully decide which aggregations, joins, or transformations merit persistence, balancing computational efficiency against storage and maintenance considerations.
Optimization extends to join structures and database interactions. Properly indexed fields, minimized redundancy in joins, and judicious selection of aggregation strategies collectively enhance performance. These considerations necessitate a dual focus: logical correctness and operational efficiency. Developers must anticipate the implications of their model designs on query execution, ensuring that analytics remain performant under diverse workloads.
Git Workflows and Version Control
Collaborative development in LookML relies heavily on Git workflows. Branching strategies allow multiple developers to experiment and implement new features without disrupting production environments. Merge requests, code reviews, and conflict resolution mechanisms ensure that changes adhere to organizational standards and maintain the integrity of existing dashboards and reports.
Effective Git integration requires careful attention to versioning, conflict resolution, and collaborative communication. The declarative nature of LookML means that even minor edits can have cascading effects, making structured review processes essential. By embedding version control into development workflows, organizations achieve both operational stability and traceability, critical for enterprise-scale analytics.
Debugging and Validation Techniques
Debugging is an essential aspect of LookML development, extending beyond simple syntax correction. Developers must interpret error messages from the Content Validator, identify logical inconsistencies, and troubleshoot unexpected behavior in derived tables or joins. Familiarity with common error patterns accelerates problem resolution, while scenario-based testing ensures models behave correctly under diverse conditions.
Validation also involves iterative review of explore behavior, measure accuracy, and field accessibility. Developers must anticipate potential edge cases, such as null propagation, duplicated records, or misaligned joins, and implement proactive safeguards. A disciplined approach to debugging reinforces conceptual understanding and promotes robust, reliable analytics.
Scenario-Based Development
Scenario-based development provides a practical framework for reinforcing LookML knowledge. Developers simulate real-world business requirements, translating abstract objectives into concrete model definitions. Examples include calculating retention metrics, segmenting sales by geography, or aggregating customer interactions across multiple touchpoints.
This method enhances problem-solving skills, reinforcing both syntactical fluency and logical reasoning. Scenario exercises also cultivate familiarity with advanced features, such as conditional filters, derived tables, and access controls, preparing developers for the complexities encountered in professional environments.
Exam Preparation Techniques
Preparing for the LookML Developer certification requires a structured approach. Due to the exam’s focus on LookML rather than general cloud services, candidates must achieve proficiency in syntax, object relationships, and performance optimization. Hands-on practice with sandbox instances, personal projects, and scenario exercises is invaluable, providing exposure to realistic tasks.
Creating self-generated practice questions and reviewing complex code blocks simulate the conditions of the exam, which often includes unformatted or lengthy LookML snippets. Regular engagement with these exercises enhances both speed and accuracy, critical for successfully navigating the time-constrained assessment.
Understanding Edge Cases
Edge cases constitute a significant portion of LookML expertise. Developers must comprehend subtleties in parameter usage, conditional references, and field accessibility. Examples include variations in referencing derived fields, differences between time-based and duration-based splits, and nuanced behaviors in filters and joins.
Mastery of these details ensures both accurate modeling and exam readiness. Beyond certification, understanding edge cases equips developers to anticipate and resolve complex analytical scenarios in operational environments, reinforcing the value of meticulous study and iterative practice.
Performance Engineering
Advanced LookML development encompasses both conceptual modeling and performance engineering. Developers consider query execution plans, indexing, join efficiency, and the cardinality of tables when designing models. Derived tables, caching strategies, and precomputed aggregations are leveraged to optimize responsiveness, balancing computational load with storage and maintenance requirements.
This dual focus—ensuring both logical correctness and operational efficiency—demands careful planning and iterative refinement. Developers must also account for underlying database behaviors, ensuring that LookML models translate efficiently into SQL and execute predictably under diverse workloads.
Integrating with Business Processes
The value of Looker manifests when models are seamlessly integrated into business processes. Dashboards and explorers inform decision-making, but their accuracy and utility rely on the integrity of the underlying LookML definitions. Developers must anticipate evolving requirements, changes in data sources, and the need for scalable solutions that maintain both performance and reliability.
Collaboration with analysts is essential. Communicating model assumptions, limitations, and dependencies ensures that dashboards meet user expectations while maintaining governance standards. This dynamic underscores the dual responsibility of LookML developers: to safeguard data integrity while enabling actionable insights.
Mastering Git for Team Collaboration
Collaboration in LookML projects often involves multiple contributors working concurrently. Git facilitates branch management, collaborative editing, and systematic review. Effective workflows include creating feature branches for isolated development, submitting pull requests for review, and resolving conflicts that arise when multiple developers modify the same objects.
Understanding Git’s role in LookML ensures both stability and traceability. Version control allows developers to experiment without jeopardizing production analytics, providing a structured environment for iterative improvement. This practice is vital for enterprise-scale deployments, where model reliability and governance are paramount.
Advanced Filters and Access Management
Filters and access management extend beyond simple data restrictions. Advanced configurations include dynamic filters that respond to user roles, conditional visibility rules, and access grants that enforce row-level security. Implementing these features requires a combination of syntactical precision, logical reasoning, and understanding of organizational policies.
Ensuring correct filter behavior is critical for both performance and compliance. Developers must balance accessibility with security, tailoring data exposure to user roles while maintaining efficiency. Misconfigurations can result in incomplete datasets, performance bottlenecks, or unauthorized access, highlighting the importance of careful design and validation.
Foundations of Looker Data Modeling
Developing a profound understanding of Looker begins with the foundations of data modeling. LookML offers a declarative framework that abstracts the complexities of SQL into reusable constructs, allowing developers to define dimensions, measures, and relationships without repeatedly writing raw queries. This abstraction is vital for maintaining consistency across dashboards and reports, enabling organizations to enforce standardized definitions for metrics and avoid discrepancies.
A well-structured data model begins with analyzing the underlying database schema, identifying key tables, fields, and relationships. Developers must consider normalization, denormalization, and the cardinality of fields, as these factors influence both performance and accuracy. Properly designed models not only support efficient queries but also provide end-users with intuitive pathways for exploration, ensuring that analysts can derive insights without being exposed to database complexities.
Designing Robust Views
Views are the elemental constructs of LookML, encapsulating the representation of tables or queries into modular components. Each view contains dimensions and measures, providing a logical structure for representing business data. Dimensions categorize data for analysis, while measures perform aggregations such as sums, counts, or averages.
Robust view design incorporates considerations of reusability and maintainability. Developers must ensure that each view is consistent with organizational definitions, supports multiple explorations, and avoids redundant calculations. Advanced techniques include defining dimension groups for time-based fields, incorporating conditional logic, and leveraging SQL expressions to create derived fields. The careful design of views is critical for producing reliable and performant analytics.
Crafting Explores
Explores allow users to interact with views in a controlled manner, offering curated entry points for analysis. Complex explores often integrate multiple views, requiring precise join definitions and careful selection of visible fields. Developers must consider the implications of join types, relationship cardinality, and filtering conditions to ensure accuracy and prevent data duplication.
In addition to structural considerations, explorers can incorporate dynamic behavior through filters and parameters. Conditional logic enables the presentation of different data slices depending on user roles or input criteria, enhancing flexibility while maintaining governance. Advanced explorers serve as versatile instruments for delivering comprehensive insights while shielding users from the complexities of underlying SQL queries.
Filters, Access Controls, and Security
Implementing filters and access controls is critical for both security and usability. Access filters restrict rows based on user roles, ensuring that sensitive information is only visible to authorized individuals. SQL-based filters such as sql_always_where or always_filter provide additional mechanisms for controlling dataset visibility, allowing developers to enforce complex constraints on queries.
Access grants complement these mechanisms, providing row-level security that aligns with organizational policies. Implementing effective access management requires careful planning and testing to ensure that no unintended data exposure occurs. Developers must balance performance considerations with security requirements, as overly complex filters can introduce query inefficiencies.
Derived Tables and Performance Optimization
Derived tables, including both SQL-derived and native constructs, are essential for precomputing complex queries and aggregations. Persistent derived tables enhance performance by storing precomputed results, minimizing real-time computation. Developers must judiciously decide which tables to persist, balancing storage, refresh frequency, and query performance.
Optimization strategies extend beyond derived tables. Efficient joins, indexed fields, and well-structured aggregations collectively contribute to query speed. Understanding database execution plans and evaluating the impact of field cardinality are necessary for producing high-performance models. Advanced developers continuously refine these strategies to ensure that dashboards remain responsive under varied workloads.
Git Integration and Collaboration
Collaboration is a cornerstone of professional LookML development. Git integration facilitates version control, branch management, and conflict resolution. Developers can experiment in isolated branches without affecting production dashboards, allowing for iterative improvements and structured reviews.
Pull requests provide a framework for peer review, ensuring adherence to best practices and organizational standards. Resolving conflicts requires careful attention, as even minor changes in one branch can impact dependent explorers or views. Effective Git workflows ensure both stability and transparency, enabling collaborative development in complex enterprise environments.
Debugging and Error Handling
Debugging in LookML extends beyond syntax correction to include logical verification and scenario-based testing. The Content Validator identifies issues such as missing references, misconfigured relationships, and syntax errors. Developers must interpret these messages carefully, understanding how the underlying model structure produces the error.
Logical errors, such as unexpected null values, duplicated data, or incorrect aggregations, require systematic investigation. Scenario-based testing allows developers to simulate real-world conditions, validating that models behave as expected across diverse inputs. This iterative approach reinforces both syntactical mastery and conceptual understanding.
Scenario-Based Exercises for Proficiency
Scenario-based exercises are invaluable for consolidating LookML knowledge. By translating hypothetical business requirements into concrete models, developers gain insight into complex interactions between views, explorers, filters, and derived tables. Examples include calculating retention rates, segmenting customers by region, or aggregating multi-source data for marketing analytics.
These exercises cultivate problem-solving skills, enhance familiarity with syntax and advanced constructs, and build confidence in managing edge cases. Regular engagement with scenarios helps developers internalize patterns, anticipate challenges, and refine their approach to both modeling and performance optimization.
Edge Cases and Advanced Syntax
Edge cases represent subtle nuances in LookML that challenge even experienced developers. Variations in field references, conditional logic, or parameter usage often lead to unexpected behaviors if overlooked. For example, referencing derived fields can differ depending on whether they arise from time-based or duration-based splits. Filters and joins may behave differently under complex scenarios, necessitating careful design.
Mastering these nuances ensures both accurate modeling and preparation for certification. Understanding edge cases fosters deeper comprehension of LookML’s behavior, enabling developers to construct robust, reliable models that withstand diverse analytical demands.
Performance Engineering in LookML
Advanced LookML development requires a dual focus on accuracy and operational efficiency. Developers must consider query execution, table cardinality, indexing, and join structures when designing models. Persistent derived tables and caching mechanisms, such as datagroups, help balance computational load with performance requirements.
Optimizing performance also involves anticipating real-world query patterns. High-traffic dashboards and frequently accessed explorers must execute efficiently without overwhelming the database. Developers refine models iteratively, balancing speed, accuracy, and resource consumption to deliver scalable and maintainable solutions.
Integration with Organizational Analytics
The utility of Looker manifests fully when data models are integrated into business workflows. Analysts rely on dashboards and explorers for decision-making, but the integrity of these outputs depends on the accuracy and consistency of underlying LookML definitions. Developers must anticipate evolving business needs, ensure model scalability, and maintain performance across changing datasets.
Collaborating with analysts is critical. Communication regarding assumptions, limitations, and dependencies allows developers to design models that meet both analytical and operational requirements. This synergy between modeling and analysis ensures that dashboards deliver actionable insights while maintaining governance and reliability.
Version Control and Workflow Best Practices
Professional LookML projects depend on disciplined version control. Git facilitates branching, isolated development, and controlled deployment. Developers utilize feature branches to implement new models or enhancements, merging changes into production after thorough review.
Conflict resolution, code review, and adherence to workflow protocols ensure model stability. Version control also provides traceability, allowing teams to understand the evolution of models over time. These practices are vital for enterprise environments, where multiple contributors must collaborate without compromising the accuracy or availability of analytics.
Advanced Filters and Security Management
Sophisticated LookML development requires nuanced control over filters and security mechanisms. Dynamic filters, conditional visibility rules, and access grants allow developers to implement granular data access policies. These mechanisms ensure compliance with privacy and governance standards while providing analysts with relevant and actionable insights.
Correct configuration is critical for both security and efficiency. Misapplied filters can expose sensitive data, produce incomplete datasets, or introduce performance bottlenecks. Developers must carefully validate filter behavior across scenarios to maintain accuracy, efficiency, and compliance.
Holistic Mastery of LookML
Mastering LookML involves integrating technical expertise with conceptual understanding. Developers construct complex views and explorers, implement dynamic filters and access controls, optimize performance, manage derived tables, collaborate through Git, and integrate models into business processes. This holistic approach ensures both reliability and flexibility, allowing organizations to leverage Looker as a robust analytics platform.
Proficiency in LookML also equips developers to navigate certification requirements with confidence. Understanding syntax, edge cases, performance considerations, and operational best practices ensures readiness for both examination and practical application.
Preparing for the Certification Exam
Certification preparation entails focused study and extensive practice. Candidates benefit from sandbox exercises, scenario-based modeling, and simulated code challenges. Exposure to unformatted LookML code, complex multi-line snippets, and performance considerations builds familiarity with the conditions of the exam.
Practice should emphasize accuracy, efficiency, and error detection. Simulated scenarios foster critical thinking, reinforcing both syntax mastery and logical reasoning. By systematically engaging with advanced constructs, candidates develop both the confidence and competence necessary to excel in certification assessments and professional environments.
The Philosophy of LookML Development
LookML embodies a philosophy of abstraction, modularity, and precision. Unlike conventional visualization tools, Looker separates the act of modeling from analysis, ensuring that end-users interact with curated data while developers maintain the integrity of underlying datasets. This abstraction fosters consistency across reports, dashboards, and explorations, allowing organizations to enforce standardized definitions for metrics, measures, and dimensions.
At its core, LookML encourages declarative modeling. Developers define the structure and behavior of data without prescribing the procedural steps of query execution. This separation between logic and execution not only simplifies maintenance but also enhances scalability, as models can be reused across multiple contexts without redundancy. Adopting this philosophy requires a shift in mindset, moving from ad hoc query construction to disciplined, structured design.
Modular Architecture and Reusability
The modular architecture of LookML is designed to support reusability and maintainability. Views encapsulate the representation of database tables, derived tables, or query results, while explorers serve as curated interfaces for end-user interaction. Each object can be referenced multiple times, promoting consistency and reducing duplication of logic.
Reusability also extends to derived constructs. Persistent derived tables, dimension groups, and calculated fields can be leveraged across multiple views or explored, creating a library of standardized components. This modularity minimizes errors, simplifies updates, and ensures that any changes propagate consistently across dashboards, maintaining the reliability of analytics outputs.
Advanced Explore Configuration
Complex explorations are central to delivering meaningful user experiences. They integrate multiple views, define joint relationships, and apply filters to create tailored analysis environments. Developers must consider join types, cardinality, and filtering rules to ensure both accuracy and performance.
Advanced explore configuration may involve dynamic parameters, conditional logic, and role-based access, adapting the analytical experience based on user context. This flexibility enhances usability while preserving governance, ensuring that users access relevant data without compromising security or accuracy.
Performance Engineering and Optimization
Optimizing LookML models requires attention to both logical correctness and operational efficiency. Performance considerations include efficient join structures, indexing, and minimizing redundant queries. Persistent derived tables and caching strategies, such as datagroups, help balance computational load with responsiveness.
High-performance dashboards require anticipating query patterns and database behavior. Developers must evaluate the impact of field cardinality, aggregation strategies, and the frequency of data refreshes. Iterative testing and refinement are critical, ensuring that models perform reliably under diverse workloads while maintaining data integrity.
Filters, Access Grants, and Security
Security is intrinsic to professional LookML development. Filters, access grants, and conditional parameters enable fine-grained control over dataset visibility. Access filters enforce row-level security, ensuring that sensitive information is only accessible to authorized users.
Developers must implement filters thoughtfully to balance performance and security. Overly complex filters may introduce latency, while misconfigured access grants can expose sensitive data. Rigorous validation, testing, and scenario analysis are essential for ensuring both compliance and usability, reflecting the dual responsibility of LookML developers as stewards of both data integrity and accessibility.
Git-Based Collaboration
Collaborative development relies heavily on Git integration. Branching strategies, feature branches, pull requests, and merge workflows facilitate organized development, enabling multiple contributors to work concurrently without disrupting production models.
Conflict resolution and structured code reviews are crucial for maintaining consistency across views and explorations. Even minor changes can propagate errors if not carefully managed, highlighting the importance of disciplined workflow practices. Git provides traceability and accountability, critical for enterprise-scale environments where multiple developers collaborate on complex data models.
Debugging, Validation, and Error Management
Debugging LookML models requires both syntactical and logical acumen. The Content Validator identifies structural errors, missing references, or misaligned relationships, while scenario-based testing reveals logical inconsistencies that may arise from complex joins, derived tables, or filters.
Effective error management demands understanding the interaction between objects, the behavior of derived fields, and potential edge cases. Null propagation, duplicate records, and misapplied aggregations can compromise dashboards if not detected early. Proactive testing and iterative validation ensure that models are both accurate and resilient, reinforcing confidence in the analytics delivered to end-users.
Scenario-Based Problem Solving
Scenario-based exercises cultivate practical expertise in LookML. By translating hypothetical business requirements into functional models, developers learn to navigate complex joins, dynamic filters, and derived tables. Scenarios might include calculating customer churn, segmenting sales by product category, or aggregating multi-source datasets.
These exercises promote critical thinking and strengthen familiarity with advanced constructs. Repeated engagement with scenario-based challenges equips developers to anticipate edge cases, troubleshoot errors, and design scalable, maintainable models. This approach bridges the gap between theoretical knowledge and practical proficiency.
Edge Cases and Subtle Syntax Variations
Edge cases are a defining aspect of LookML mastery. Subtle syntax variations—such as differences in referencing fields across time-based or duration-based splits—can have significant effects on model behavior. Misapplied filters, conditional logic errors, or overlooked relationships may lead to inaccurate metrics or performance degradation.
Understanding and internalizing these nuances ensures both robust modeling and certification readiness. Developers learn to detect inconsistencies, apply corrective measures, and anticipate scenarios that could compromise dashboards or reports. Mastery of edge cases distinguishes proficient developers from those with only superficial familiarity.
Advanced Derived Tables and Precomputation
Derived tables, including persistent derived tables, are fundamental to high-performance LookML modeling. They enable precomputation of complex aggregations, minimizing runtime query complexity and enhancing dashboard responsiveness. Developers must balance persistence with storage and refresh frequency, ensuring efficient performance without excessive resource consumption.
Advanced derived table design considers dependencies, primary keys, and relationships with other views or explorers. Properly structured derived tables enhance scalability, support reusability, and provide predictable query behavior, forming a critical component of enterprise-level analytics solutions.
Integration with Organizational Workflows
Looker’s value emerges fully when integrated into business processes. Dashboards inform decisions, but their reliability depends on the accuracy, performance, and governance of the underlying LookML models. Developers must anticipate changes in data sources, business requirements, and reporting needs to maintain scalable and resilient analytics infrastructure.
Effective collaboration with analysts ensures that models meet both technical and business expectations. Communicating assumptions, limitations, and dependencies enables the delivery of actionable insights while safeguarding data integrity. This alignment between development and analysis is essential for maximizing the platform’s impact.
Holistic Approach to Mastery
Proficiency in LookML encompasses technical, conceptual, and operational dimensions. Developers construct complex views and explorers, implement dynamic filters and access controls, optimize performance, manage derived tables, debug errors, and integrate models into business processes. This holistic approach ensures reliability, scalability, and flexibility across analytics environments.
Holistic mastery also prepares candidates for certification. Understanding syntax, edge cases, filters, derived tables, performance considerations, and workflow integration equips developers to excel in both examination and real-world application, demonstrating their capability to translate complex business requirements into actionable analytics solutions.
Preparing for Certification
Effective certification preparation involves structured study, hands-on practice, and scenario-based exercises. Sandbox environments, personal projects, and simulated code challenges provide exposure to complex LookML constructs and unformatted multi-line code snippets, reflecting the conditions of the actual exam.
Practice should focus on accuracy, efficiency, and error detection, cultivating familiarity with syntax, filters, derived tables, and performance optimization. Regular engagement with advanced scenarios reinforces conceptual understanding, enhancing both confidence and competence. Systematic preparation ensures readiness for the certification assessment and professional application.
Strategic Insights for LookML Development
Beyond technical proficiency, LookML development demands strategic thinking. Developers must consider long-term maintainability, adaptability to changing requirements, and alignment with organizational governance policies. Designing modular, reusable models, optimizing performance, and implementing robust access controls are as important as syntactical mastery.
Strategic insights also involve anticipating user needs. Developers must understand how analysts interact with explorers and dashboards, designing models that are intuitive, flexible, and reliable. This foresight ensures that Looker delivers value consistently, supporting data-driven decision-making while maintaining operational efficiency.
Conclusion
The LookML Developer journey encompasses a synthesis of technical proficiency, conceptual understanding, and operational acumen. Unlike conventional visualization tools, Looker separates modeling from analysis, requiring developers to construct robust, reusable abstractions that underpin dashboards, explorations, and reports. Mastery of LookML entails designing views with precise dimensions and measures, configuring explorers with accurate joins, and implementing dynamic filters and access controls that safeguard both data integrity and user accessibility. Each of these elements contributes to a cohesive, reliable analytics environment that empowers stakeholders to derive actionable insights without interacting directly with raw SQL.
Performance optimization is equally crucial, encompassing persistent derived tables, caching strategies, efficient joins, and thoughtful indexing. Developers must anticipate query patterns, assess the cardinality of data, and balance computational load with storage considerations. Git-based collaboration and version control further ensure stability, transparency, and maintainability, enabling multiple contributors to work concurrently without compromising production analytics.
Scenario-based exercises, edge case analysis, and debugging reinforce practical expertise, bridging the gap between theoretical understanding and real-world application. This comprehensive approach not only prepares developers for the LookML Developer certification but also equips them to design enterprise-grade models capable of scaling with evolving business requirements. Ultimately, LookML mastery reflects a blend of meticulous attention to detail, strategic foresight, and iterative refinement. Developers who achieve fluency are positioned to deliver reliable, performant, and maintainable analytics solutions, transforming complex data into structured, accessible insights that drive informed decision-making across organizations.
Frequently Asked Questions
Where can I download my products after I have completed the purchase?
Your products are available immediately after you have made the payment. You can download them from your Member's Area. Right after your purchase has been confirmed, the website will transfer you to Member's Area. All you will have to do is login and download the products you have purchased to your computer.
How long will my product be valid?
All Testking products are valid for 90 days from the date of purchase. These 90 days also cover updates that may come in during this time. This includes new questions, updates and changes by our editing team and more. These updates will be automatically downloaded to computer to make sure that you get the most updated version of your exam preparation materials.
How can I renew my products after the expiry date? Or do I need to purchase it again?
When your product expires after the 90 days, you don't need to purchase it again. Instead, you should head to your Member's Area, where there is an option of renewing your products with a 30% discount.
Please keep in mind that you need to renew your product to continue using it after the expiry date.
How often do you update the questions?
Testking strives to provide you with the latest questions in every exam pool. Therefore, updates in our exams/questions will depend on the changes provided by original vendors. We update our products as soon as we know of the change introduced, and have it confirmed by our team of experts.
How many computers I can download Testking software on?
You can download your Testking products on the maximum number of 2 (two) computers/devices. To use the software on more than 2 machines, you need to purchase an additional subscription which can be easily done on the website. Please email support@testking.com if you need to use more than 5 (five) computers.
What operating systems are supported by your Testing Engine software?
Our testing engine is supported by all modern Windows editions, Android and iPhone/iPad versions. Mac and IOS versions of the software are now being developed. Please stay tuned for updates if you're interested in Mac and IOS versions of Testking software.