Certification: CAAPA
Certification Full Name: Cisco AppDynamics Associate Performance Analyst
Certification Provider: Cisco
Exam Code: 500-420
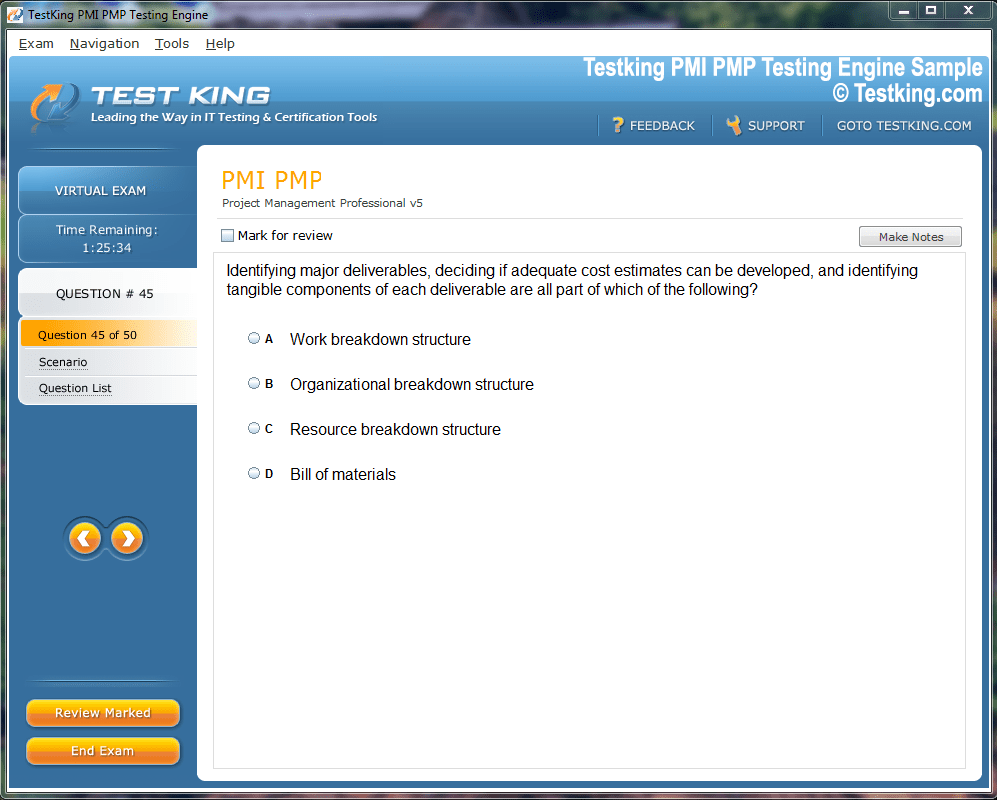
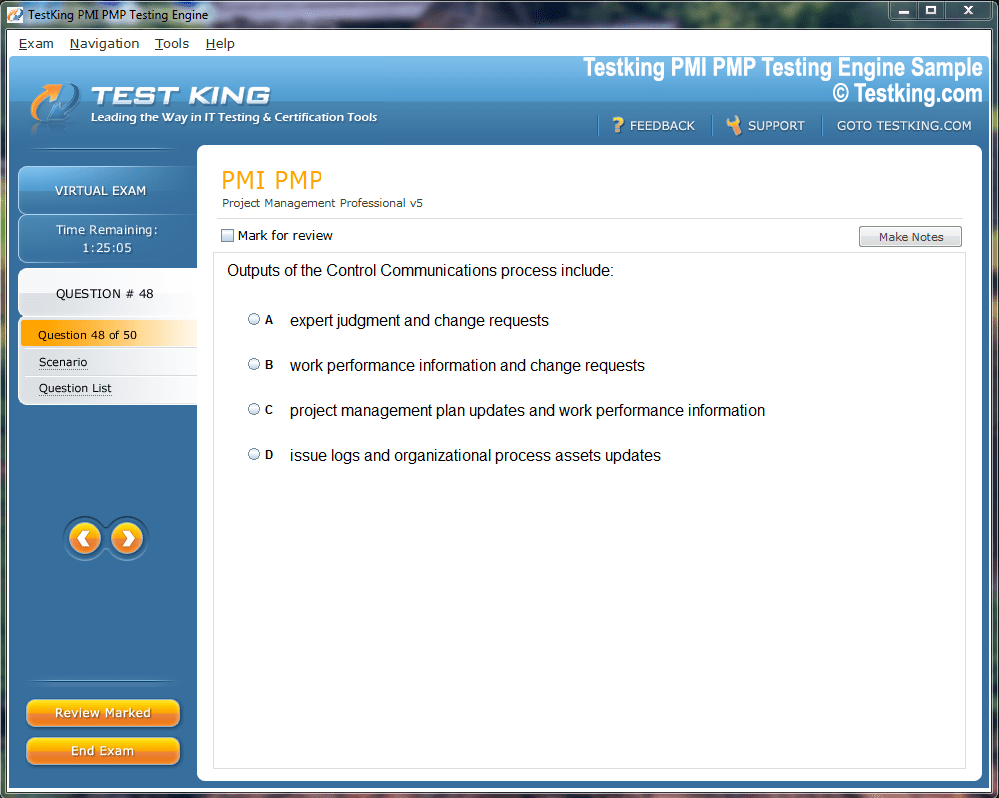
Product Screenshots
nop-1e =1
Mastering Application Performance Management with CAAPA Certification
The evolution of digital technology has dramatically altered the architecture and functioning of modern applications. From the early days of isolated software systems to the present era of cloud-driven environments, the transformation has been both swift and profound. This continuous progression has reshaped not only how applications are developed but also how they are managed, monitored, and optimized. The need for consistent application performance monitoring has become a fundamental aspect of enterprise success, ensuring that organizations can maintain the reliability and speed demanded by users in a fast-paced technological landscape.
The Shift from Standalone Systems to Connected Architectures
In the early stages of software development, most applications were standalone entities installed and executed on individual computers. These programs performed specific functions, with limited interaction beyond the local environment. Maintenance and updates were manual, often requiring physical installation or patching. As organizations expanded, so did the need for interconnectivity, scalability, and remote accessibility. This led to the emergence of client-server models, where data and processes were distributed between servers and clients across networks.
The client-server architecture introduced a dynamic operational model that improved efficiency and collaboration, but it also brought new challenges in managing distributed resources. As businesses increasingly relied on interconnected systems, the demand for performance visibility grew. Administrators needed the ability to analyze, troubleshoot, and optimize the end-to-end user experience across multiple platforms.
The Emergence of Web-Based and Cloud-Native Applications
The proliferation of the internet in the late 1990s and early 2000s gave rise to web-based applications, fundamentally transforming the user experience. Unlike desktop applications, web applications could be accessed from anywhere through a browser, significantly reducing dependency on local installations. This new model offered scalability, ease of deployment, and streamlined maintenance.
However, the growing complexity of these systems created challenges in maintaining consistent performance. Applications became multi-tiered, relying on intricate networks of servers, databases, and APIs. The introduction of microservices and containerization further decentralized application infrastructure. Each microservice operated independently, communicating with others through APIs, increasing the overall complexity of monitoring performance across environments.
As enterprises transitioned to cloud-based ecosystems, performance management took on an even greater importance. Cloud environments, while flexible and scalable, introduced variables such as dynamic resource allocation, fluctuating workloads, and shared infrastructure. Ensuring consistent application behavior across such environments required advanced monitoring tools capable of tracking performance at every layer—from the user interface to backend services.
The Crucial Role of Application Performance Monitoring
Application performance monitoring (APM) has become indispensable in maintaining business continuity and enhancing user experience. APM tools provide visibility into application health, latency, resource utilization, and overall performance. They empower organizations to detect bottlenecks, identify slow transactions, and address issues before they affect end users. The efficiency of these tools lies in their ability to collect and analyze performance metrics across distributed systems, giving teams the insights needed for optimization and preventive maintenance.
Modern APM solutions are not limited to reactive monitoring; they are deeply integrated with proactive analytics, machine learning, and automation. This convergence allows systems to predict potential failures, auto-scale resources, and deliver consistent service levels even under varying workloads. In highly competitive industries, these capabilities translate to reduced downtime, improved customer satisfaction, and stronger operational resilience.
Introduction to AppDynamics as an APM Solution
Among the diverse array of application performance management tools available today, AppDynamics has established itself as a leader due to its comprehensive analytical capabilities and integration flexibility. Developed as part of Cisco’s software suite, AppDynamics offers end-to-end visibility into application ecosystems, enabling teams to understand the intricate relationships between services, infrastructure, and user experiences.
AppDynamics monitors the full application journey—from code execution and business transactions to user interactions and infrastructure performance. It captures granular data in real time, presenting it through intuitive dashboards and visualizations that simplify complex metrics. This capability allows organizations to identify and resolve performance issues with precision, ensuring that business-critical applications function seamlessly.
For enterprises managing complex architectures, the insights provided by AppDynamics extend beyond technical performance. They enable alignment between IT and business objectives by mapping technical metrics to business outcomes, helping decision-makers assess the impact of performance on revenue and customer experience.
Understanding the Cisco AppDynamics Associate Performance Analyst Certification
Due to the technical sophistication of AppDynamics, professionals seeking to specialize in performance analysis often pursue structured learning pathways. The Cisco AppDynamics Associate Performance Analyst (500-420 CAAPA) certification validates an individual’s foundational knowledge and practical expertise in utilizing AppDynamics for monitoring, optimization, and analysis. This certification is designed for IT professionals, analysts, and administrators who play a role in maintaining enterprise application health.
The certification assesses the candidate’s understanding of key concepts such as agents, application performance, business transactions, health rules, dashboards, snapshots, collectors, and service endpoints. By mastering these domains, certified professionals gain the ability to interpret complex performance data, design effective monitoring strategies, and contribute to efficient system management.
The Cisco 500-420 CAAPA exam comprises 55 to 65 questions, which candidates must complete within a 90-minute timeframe. It tests both theoretical understanding and applied knowledge, ensuring that certification holders can handle real-world scenarios. The cost of the examination is 300 USD, representing an investment in professional growth and technical expertise.
Importance of Certified Performance Analysts in Modern Enterprises
As organizations continue to adopt hybrid and multi-cloud environments, the need for skilled performance analysts has become more pronounced. Certified professionals equipped with AppDynamics expertise serve as the backbone of performance assurance within IT departments. They possess the analytical proficiency to diagnose performance bottlenecks, interpret telemetry data, and implement optimization strategies aligned with organizational goals.
In large enterprises where digital transformation initiatives are ongoing, maintaining consistent performance across multiple platforms and services can be challenging. Certified performance analysts act as the bridge between development teams, operations, and business leadership. They translate performance metrics into actionable insights that inform strategic decisions, helping organizations maintain operational excellence.
The Relationship Between Performance Analysis and Business Value
Application performance analysis is not solely a technical function; it directly influences business outcomes. When applications operate efficiently, user satisfaction increases, transaction times decrease, and system reliability improves. Conversely, poor performance can lead to user frustration, revenue loss, and reputational damage.
By leveraging tools like AppDynamics, organizations gain the ability to measure application health in terms of business impact. This alignment ensures that performance metrics are not isolated from strategic goals but rather contribute to measurable value creation. For instance, analyzing slow transactions in an e-commerce platform can reveal issues that directly affect sales conversion rates. Similarly, monitoring API latency in financial systems can help ensure compliance with service-level agreements.
The Evolving Skillset of Performance Analysts
The role of a performance analyst has evolved alongside the technology landscape. Earlier, performance monitoring was limited to basic system metrics such as CPU usage, memory consumption, and network throughput. Modern analysts, however, operate in environments that demand a deep understanding of distributed systems, cloud computing, and automation frameworks.
Proficiency in AppDynamics requires not only familiarity with its interface but also the ability to interpret data contextually. Analysts must understand how code execution, database queries, and infrastructure components interconnect within complex architectures. They must also be capable of designing custom dashboards, configuring alert policies, and implementing health rules tailored to business priorities.
This evolving skillset underscores the necessity of structured certification programs like the Cisco AppDynamics Associate Performance Analyst credential. Through such certifications, professionals acquire a blend of theoretical knowledge and practical competence, enabling them to adapt to the rapidly changing technological ecosystem.
Challenges in Application Performance Management
Despite the availability of advanced APM tools, maintaining optimal application performance remains a multifaceted challenge. One primary difficulty lies in the distributed nature of modern applications, which often span multiple data centers and cloud providers. Each layer—frontend, middleware, and backend—can contribute to latency or failures if not properly monitored.
Another challenge is data volume. APM systems generate enormous quantities of telemetry data, logs, and metrics. Without proper filtering and correlation, teams can be overwhelmed by alerts, making it difficult to distinguish between critical issues and insignificant fluctuations. The integration of artificial intelligence and machine learning within APM tools like AppDynamics helps mitigate this issue by identifying patterns and automating anomaly detection.
Security is another growing concern. As performance data often includes sensitive information about system behavior and transactions, it must be managed securely to prevent breaches or misuse. Certified professionals trained in best practices ensure that monitoring processes adhere to organizational and regulatory security standards.
The Strategic Impact of AppDynamics on IT Operations
AppDynamics plays a transformative role in modern IT operations by fostering a culture of proactive performance management. Rather than waiting for incidents to disrupt business processes, organizations can leverage continuous monitoring and predictive analytics to anticipate potential failures. This shift from reactive to proactive management leads to greater stability and resource efficiency.
Through real-time insights, AppDynamics helps teams understand the interplay between various components within an ecosystem. This understanding allows for faster root cause identification and resolution, reducing mean time to recovery (MTTR). Moreover, the ability to visualize application dependencies assists in planning upgrades, migrations, and infrastructure expansions with minimal disruption.
In addition, AppDynamics integrates seamlessly with DevOps practices. Continuous integration and deployment pipelines benefit from its monitoring capabilities, as developers can identify performance regressions during testing stages rather than post-deployment. This synergy between monitoring and development accelerates delivery cycles while maintaining quality.
Understanding Application Performance in a Dynamic Enterprise Landscape
In today’s interconnected and digitally dependent environment, applications serve as the operational nucleus of nearly every enterprise. They manage transactions, facilitate communication, automate workflows, and deliver the user experiences that define organizational success. As businesses expand across geographies and digital ecosystems, application performance becomes a determining factor in efficiency and customer satisfaction. The growing complexity of systems, coupled with diverse user demands, has transformed performance analysis from a background operation into a strategic priority.
The Increasing Complexity of Enterprise Applications
Enterprise applications have evolved into intricate ecosystems composed of multiple interdependent layers. Modern solutions are rarely monolithic; instead, they operate within distributed architectures that span across networks, data centers, and cloud infrastructures. These systems are composed of numerous services, databases, and external integrations that together form a functional whole. While such architectures deliver scalability and flexibility, they also introduce challenges in maintaining seamless performance.
An enterprise-grade application may involve hundreds of microservices, each responsible for specific tasks. These services communicate through APIs, creating a network of dependencies that can affect performance at any point. A single delay in one component can cascade through the entire system, leading to slower response times or degraded user experiences. Performance analysts must navigate these complexities with precision, identifying and resolving latency issues that arise from network congestion, code inefficiencies, or resource constraints.
The introduction of containers and orchestration platforms such as Kubernetes has further diversified deployment environments. While these technologies enable rapid scaling and efficient resource utilization, they also make performance monitoring more multifaceted. Analysts must understand how containerized applications behave under varying loads, how they interact with host systems, and how orchestration impacts availability and reliability.
The Centrality of Application Performance Monitoring
Application performance monitoring, often abbreviated as APM, provides the mechanism by which organizations gain insight into these intricate environments. APM tools serve as the observatory through which analysts can visualize the health and behavior of applications across layers and geographies. They track real-time performance metrics, detect anomalies, and correlate issues to their sources, enabling proactive management of potential disruptions.
Performance monitoring extends beyond traditional server metrics. It encompasses end-user experience, transaction times, backend processing, and infrastructure performance. The objective is not merely to collect data but to derive meaningful interpretations that guide optimization. In high-volume digital systems, milliseconds of latency can have substantial financial implications, particularly in industries such as finance, retail, or telecommunications.
A robust monitoring framework ensures operational transparency. It allows teams to pinpoint where performance degradation originates—whether in the code execution layer, network infrastructure, or database query structure. This visibility empowers organizations to maintain service continuity, enhance reliability, and deliver consistent experiences to users worldwide.
AppDynamics as an Analytical Framework
AppDynamics has emerged as one of the most comprehensive tools for performance analysis and management. Its ability to provide end-to-end visibility makes it particularly valuable for enterprises dealing with complex architectures. The platform captures telemetry data from every stage of an application’s lifecycle, consolidating metrics that help analysts correlate technical issues with business outcomes.
Unlike conventional monitoring systems that rely solely on raw data, AppDynamics integrates contextual intelligence into its operations. It maps application topologies automatically, displaying the relationships between components and highlighting areas of concern. This automated discovery is crucial for enterprises where application environments are constantly changing due to updates, new deployments, or scaling activities.
AppDynamics also supports multi-layered monitoring, including agents deployed at different points within the architecture. These agents gather performance data from application servers, databases, browsers, and network connections. The resulting insights enable a holistic understanding of system performance, allowing organizations to prioritize remediation efforts based on impact severity.
Core Components in AppDynamics Architecture
To comprehend how AppDynamics operates, it is essential to understand its primary components. Each element within its architecture plays a distinct role in collecting, processing, and presenting performance data.
The first layer involves agents, lightweight software entities installed on application nodes or servers. They monitor real-time performance metrics, capturing detailed information about transaction flows, resource consumption, and error rates. These agents send the collected data to the controller, the central management console within the AppDynamics environment.
The controller acts as the analytical hub, aggregating and processing incoming data. It correlates information from multiple agents, applying algorithms to identify trends, anomalies, and dependencies. The processed data is then visualized through dashboards, which provide a graphical representation of application performance. These dashboards are customizable, allowing users to focus on specific components or metrics relevant to their operations.
Another crucial element is the event service, which handles large-scale data ingestion and indexing. It enables fast querying and visualization of performance data, ensuring that analysts can access historical and real-time insights with minimal latency. Together, these components form an integrated ecosystem capable of delivering continuous performance intelligence.
Business Transactions as the Core Analytical Unit
A distinguishing feature of AppDynamics is its focus on business transactions as the core analytical entity. A business transaction represents a logical user interaction with an application, such as placing an order, logging into a portal, or retrieving account details. By monitoring these transactions, analysts can trace performance across the entire application path, from user initiation to backend completion.
This approach provides a business-oriented perspective of performance analysis. Instead of monitoring isolated technical components, AppDynamics links performance metrics directly to business functions. It allows organizations to quantify how technical issues affect operational outcomes. For instance, identifying a slow transaction path in an e-commerce platform can directly relate to reduced conversion rates, while a delay in authentication services can impact customer satisfaction.
Each transaction is monitored through multiple stages, capturing metrics like response time, error rate, and throughput. Analysts can drill down into each layer to diagnose performance bottlenecks—whether arising from database latency, external API calls, or inefficient code execution. This transaction-centric methodology simplifies the process of correlating technical performance with user experience.
Performance Baselines and Anomaly Detection
Effective performance analysis requires an understanding of what constitutes normal behavior. AppDynamics facilitates this through performance baselining, a process that establishes standard operational parameters based on historical data. Once baselines are defined, the system automatically detects deviations that may indicate emerging issues.
This capability is particularly valuable in large-scale environments where manual monitoring would be impractical. AppDynamics applies dynamic baselining, which adapts to evolving workloads and seasonal variations. By continuously learning from patterns, it can distinguish between legitimate workload spikes and potential performance degradation.
When anomalies occur, AppDynamics generates alerts that provide contextual information about the issue. These alerts are prioritized based on severity and potential business impact, allowing teams to respond efficiently. The integration of intelligent baselining reduces false alarms, ensuring that operational attention is directed toward critical incidents.
Health Rules, Dashboards, and Visualization
Visualization is central to effective monitoring. AppDynamics provides an extensive framework for creating dashboards that display performance indicators in real time. These dashboards consolidate data from multiple sources, presenting it in an accessible format for both technical and managerial audiences.
Health rules define thresholds for acceptable performance. When metrics exceed these predefined limits, the system triggers alerts and displays the affected components on dashboards. This enables analysts to assess system health instantly and identify potential issues before they escalate. Dashboards can be customized for various roles within an organization—developers may focus on code-level metrics, while executives might view aggregated performance summaries.
Snapshots, another important feature, capture detailed data at specific moments in time. These are invaluable for retrospective analysis, allowing teams to examine the exact conditions under which an issue occurred. Snapshots include transaction traces, resource utilization, and configuration states, providing comprehensive context for troubleshooting.
Troubleshooting in Complex Environments
One of the most critical capabilities within performance monitoring is the ability to troubleshoot issues efficiently. In complex application environments, identifying the root cause of performance degradation can be akin to navigating a labyrinth of interconnected systems. AppDynamics simplifies this process through automated correlation and diagnostic tools.
When a performance issue arises, the system highlights the affected transactions, displaying their flow through the application topology. Analysts can observe where latency begins, how it propagates, and which components contribute to the delay. The platform provides diagnostic snapshots that include stack traces and execution details, enabling rapid identification of the problem’s origin.
Furthermore, AppDynamics supports integration with log analytics tools, allowing cross-correlation between logs and performance data. This integration provides an even deeper level of visibility, ensuring that every performance irregularity is understood in context. In enterprise operations where downtime translates to significant financial impact, such precision is indispensable.
The Role of Collectors and Service Endpoints
Collectors in AppDynamics gather supplementary data beyond standard transaction metrics. They capture information from databases, message queues, or external services that may not be directly instrumented by agents. This additional layer of data collection enhances the completeness of performance analysis.
Service endpoints, meanwhile, represent entry points into applications, such as APIs or network interfaces. Monitoring these endpoints provides insight into how external interactions affect overall system performance. Analysts can observe request volumes, latency, and error rates, ensuring that third-party integrations or external dependencies do not compromise service quality.
The combination of collectors and service endpoints contributes to a multidimensional perspective of application behavior. It enables analysts to trace dependencies and interactions that extend beyond the core application architecture, providing a holistic view of performance across the enterprise ecosystem.
Mastering AppDynamics: A Deep Dive into Components, Functionality, and Analytical Precision
Application ecosystems in modern enterprises resemble living organisms—constantly evolving, adapting, and responding to shifting demands. To ensure these dynamic systems operate with efficiency and stability, performance monitoring must extend beyond superficial observation. It requires an analytical framework capable of dissecting every process, tracing every transaction, and connecting the subtle relationships that influence performance outcomes. AppDynamics, developed under Cisco’s software intelligence umbrella, provides this framework through a unified and methodical approach to application performance management.
The Foundation of AppDynamics Architecture
At the heart of AppDynamics lies a distributed architecture designed for scalability, precision, and real-time insight. Its ecosystem is composed of interconnected modules that collaborate to collect, process, and visualize performance data. Each element operates autonomously while contributing to the collective intelligence of the system.
The fundamental architecture of AppDynamics comprises several layers, beginning with agents, followed by the controller, the event service, and dashboards. These components maintain continuous communication, ensuring that performance information flows seamlessly from monitored applications to the user interface. The design supports cloud-native environments, hybrid infrastructures, and on-premises systems, making it adaptable to diverse enterprise needs.
Agents function as silent observers, embedded within application environments. They monitor transactions, track code execution, and record performance statistics across servers, databases, and end-user devices. The controller acts as the orchestrator, aggregating data from these agents, correlating events, and generating actionable insights. The event service, on the other hand, handles high-volume data ingestion, enabling AppDynamics to process millions of events in near real time.
Together, these components form a robust data pipeline that provides a continuous stream of performance intelligence, ensuring that analysts have immediate access to the information necessary for maintaining application health.
Agents: The Observers of Digital Behavior
Agents are the operational sensors of AppDynamics. They operate invisibly within the monitored environment, collecting performance metrics without interfering with application functionality. Each agent is designed to observe a specific aspect of system behavior, ensuring comprehensive coverage of all layers.
Application agents monitor performance at the code level, tracing transaction execution paths and measuring response times. They help identify inefficient methods, slow database calls, or misconfigured services that hinder performance. Machine agents, on the other hand, focus on infrastructure metrics such as CPU utilization, memory consumption, and disk I/O. This dual perspective allows for correlation between application behavior and underlying system resources.
In addition, database agents monitor query execution times, connection pools, and database locks, while browser real-user monitoring agents capture end-user experience data directly from client interactions. These agents measure page load times, browser rendering delays, and user navigation paths, allowing organizations to understand performance from the user’s viewpoint.
AppDynamics agents function collectively to create a multidimensional perspective of system performance. Their ability to operate in distributed, hybrid, and multi-cloud environments makes them invaluable in tracking performance across complex infrastructures.
The Controller: The Centralized Nucleus
The controller is the analytical nucleus of the AppDynamics ecosystem. It receives data from various agents, processes it using advanced algorithms, and presents it through an intuitive user interface. Functioning as the command center, the controller allows administrators to manage configurations, define health rules, create dashboards, and analyze performance data.
The controller’s intelligence lies in its ability to correlate disparate data points. It automatically maps application topologies, identifying dependencies between components and highlighting potential performance bottlenecks. This automated discovery ensures that monitoring remains consistent even as environments evolve through continuous deployments or scaling events.
Within the controller, the concept of flow maps is integral. Flow maps visually represent how data moves across different tiers and services, illustrating the relationships between them. This visualization enables analysts to pinpoint precisely where latency originates and how it affects the overall transaction flow.
The controller also supports user access control, multi-tenancy, and role-based permissions, ensuring secure and organized management of monitoring environments. Its data visualization capabilities serve not only technical teams but also business stakeholders who rely on performance intelligence for decision-making.
Event Service: The Engine of Data Ingestion and Analysis
In environments where thousands of transactions occur every second, traditional data processing approaches are insufficient. The AppDynamics event service addresses this challenge by serving as a high-performance data engine. It collects, indexes, and stores performance events, making them accessible for analysis and visualization.
This component enables the system to manage large-scale data volumes without sacrificing performance. It supports both historical and real-time querying, allowing analysts to review trends over time and correlate them with current conditions. The event service underpins features such as analytics, baselining, and anomaly detection, ensuring that AppDynamics remains responsive even in demanding operational contexts.
Through advanced data indexing, the event service enhances the speed and accuracy of search operations. Analysts can retrieve detailed transaction traces, performance snapshots, and historical records within seconds, facilitating rapid diagnostics and post-incident reviews.
Dashboards: The Art of Performance Visualization
The significance of visualization in performance analysis cannot be overstated. AppDynamics dashboards transform intricate data sets into visual narratives that enable quick comprehension and decision-making. Dashboards can be customized to display specific metrics, such as throughput, error rates, or transaction response times, and they can be tailored for various audiences.
Technical teams often rely on operational dashboards that present granular data, while executives prefer summarized overviews that highlight trends and anomalies. The flexibility to create role-specific dashboards ensures that every stakeholder gains insights relevant to their responsibilities.
Dashboards also support health rules, which define acceptable performance thresholds. When metrics deviate beyond these boundaries, visual indicators signal the issue, prompting immediate investigation. For instance, a dashboard might display a red alert if transaction response times exceed baseline expectations.
These visual tools promote proactive performance management by providing continuous situational awareness. Analysts can identify emerging issues before they escalate into critical incidents, ensuring that service quality remains consistent across operational cycles.
The Concept of Business Transactions in AppDynamics
AppDynamics differentiates itself through its focus on business transactions as the principal unit of measurement. Unlike conventional monitoring systems that focus solely on technical parameters, AppDynamics interprets performance from the perspective of user activity.
A business transaction represents a single logical unit of user interaction—such as submitting a payment, logging into an account, or generating a report. AppDynamics traces the complete path of each transaction across different tiers, including application servers, databases, and external services. This approach allows analysts to see how individual requests flow through the system and where delays or failures occur.
Monitoring business transactions bridges the gap between technical performance and user experience. It enables organizations to align IT operations with business objectives, understanding not only how an application performs but also how its performance affects customer satisfaction and revenue.
Through detailed transaction snapshots, AppDynamics records each step of execution, providing developers and analysts with deep insights into bottlenecks. The ability to trace transactions across distributed systems enhances visibility, especially in architectures based on microservices and APIs.
Health Rules and Performance Baselines
Establishing clear baselines is essential to identifying anomalies effectively. AppDynamics automatically generates performance baselines by analyzing historical data. These baselines represent the expected range of normal behavior for metrics such as response time, throughput, and resource usage.
Once baselines are established, analysts can define health rules that specify acceptable performance thresholds. If a metric deviates significantly from its baseline, AppDynamics triggers an alert. The dynamic nature of baselining ensures that performance standards adapt to evolving workloads, eliminating the need for constant manual recalibration.
Health rules operate hierarchically, encompassing applications, business transactions, and infrastructure components. This structured approach allows organizations to maintain precise control over monitoring sensitivity and alerting mechanisms. By combining baselines with health rules, AppDynamics fosters a balance between proactive oversight and operational stability.
Snapshots: Precision Diagnostics for Performance Analysis
AppDynamics offers a powerful feature known as snapshots, which capture the state of an application during specific events or anomalies. A snapshot contains comprehensive information, including transaction traces, system metrics, and code execution paths.
Snapshots serve as forensic tools for post-incident analysis. When an issue occurs, analysts can review the snapshot to understand what transpired, identifying the root cause with exceptional clarity. Each snapshot provides a timestamped record of application activity, revealing which components were involved and how they interacted.
This capability accelerates troubleshooting, reducing the mean time to resolution (MTTR) and preventing recurrence. By examining snapshots, teams can validate hypotheses about performance degradation and refine their optimization strategies accordingly.
The Process of Troubleshooting in AppDynamics
Troubleshooting within AppDynamics is a systematic and data-driven process. When anomalies are detected, analysts begin by examining affected transactions and identifying patterns across performance metrics. The system’s visual flow maps help locate bottlenecks and pinpoint the specific tiers contributing to latency.
The next step involves analyzing diagnostic snapshots, which reveal detailed information about the affected components. Stack traces and execution logs guide analysts toward problematic code segments or resource constraints. Machine agents provide infrastructure context, indicating whether hardware limitations are influencing application behavior.
AppDynamics supports automation in this process by correlating multiple data sources, enabling analysts to move from symptom to root cause with minimal manual intervention. This efficiency is particularly valuable in environments where downtime must be minimized.
Advanced Features: Analytics and Machine Learning Integration
AppDynamics extends beyond traditional monitoring by integrating analytics and machine learning capabilities. Its analytical engine processes performance data to identify patterns, predict anomalies, and recommend optimization measures.
Machine learning algorithms enable predictive insights, helping organizations anticipate potential issues before they occur. For example, by analyzing seasonal traffic patterns, the system can predict periods of high demand and suggest scaling actions.
This predictive capability transforms performance management from a reactive discipline into a proactive one. By anticipating challenges, organizations can allocate resources more effectively, ensuring seamless application availability even during peak usage.
Strategic Mastery in AppDynamics: Troubleshooting, Data Interpretation, and Proactive Performance Management
The realm of application performance management has matured beyond simple observation and reactive problem-solving. In complex digital ecosystems, issues must be detected, analyzed, and mitigated with surgical precision, often before they disrupt user experience or business continuity. AppDynamics, as part of Cisco’s portfolio, embodies this philosophy by enabling proactive management through comprehensive diagnostics and data-driven insights. Its framework integrates technical intelligence, automation, and analytical modeling, providing organizations with the means to maintain seamless application operations.
Identifying the Early Signals of Performance Degradation
One of the distinguishing capabilities of AppDynamics lies in its ability to recognize early warning signs of performance degradation. Instead of waiting for full-scale failures, the system continuously evaluates transaction data against historical baselines. Subtle increases in response time or memory consumption can trigger health rule violations, alerting administrators before end-users notice any impact.
These alerts are not random notifications but intelligently designed indicators based on behavioral baselines. AppDynamics employs dynamic thresholds that evolve with application behavior. For example, if an application experiences increased traffic during specific business hours, the system automatically adjusts its expectations to accommodate this pattern. This adaptive intelligence ensures that alerts remain relevant and actionable.
Moreover, AppDynamics incorporates anomaly detection mechanisms powered by analytical modeling. When the system identifies metric patterns that deviate significantly from predicted norms, it flags them as potential anomalies. Analysts can then investigate these deviations using detailed transaction snapshots, gaining insight into the sequence of events that led to the anomaly.
This predictive capacity transforms troubleshooting from a reactive discipline into a strategic function. It empowers performance analysts to act preemptively, addressing issues before they manifest as operational disruptions.
Deep Dive into Diagnostic Snapshots
Snapshots are among the most powerful diagnostic tools in AppDynamics. Each snapshot captures a precise moment in time, recording the full transaction flow, execution stack, and associated metrics. They serve as digital imprints of application behavior, enabling forensic-level analysis.
When an anomaly occurs, AppDynamics automatically generates a snapshot of the affected transaction. This snapshot includes details such as method call durations, error occurrences, database queries, and external service calls. Analysts can review this data to pinpoint which component introduced latency or failure.
Snapshots are not static records; they are interactive diagnostic aids. Analysts can drill down into specific method calls, trace variable states, and examine code-level details. This granularity allows for efficient identification of performance bottlenecks that might otherwise remain obscured.
Furthermore, AppDynamics categorizes snapshots based on their significance. Slow transactions, stalled requests, and error-prone executions are automatically prioritized for review. By focusing on these critical transactions, analysts can direct their efforts where they yield the most substantial performance improvements.
Correlation Between Business Transactions and Infrastructure Metrics
The interdependence between business transactions and infrastructure health defines the essence of modern performance analysis. AppDynamics bridges this gap by correlating application-level behavior with system-level metrics.
For instance, if a checkout process in an e-commerce application slows down, the issue might stem from database contention, excessive garbage collection, or network congestion. AppDynamics correlates these layers automatically, showing how infrastructure anomalies affect specific business transactions.
Machine agents contribute valuable insight to this correlation by monitoring CPU load, memory availability, thread usage, and disk I/O. When performance deviations occur, these metrics help analysts determine whether the root cause lies in application logic or resource constraints.
This multidimensional analysis strengthens the accuracy of troubleshooting and promotes collaboration between application developers, operations teams, and infrastructure engineers. It ensures that performance issues are addressed holistically rather than through isolated interventions.
The Role of Flow Maps in Troubleshooting
Flow maps are a visual representation of how data and processes move through an application’s architecture. In AppDynamics, they serve as a vital navigational aid during troubleshooting. Each flow map displays the relationship between services, databases, and external endpoints, illustrating how transactions traverse the ecosystem.
When anomalies arise, the affected nodes or tiers are highlighted, allowing analysts to identify bottlenecks instantly. Flow maps update dynamically as new transactions occur, ensuring that they always reflect the most current system state.
By examining flow maps, performance analysts can see the entire transaction journey—from the initial user request to the final response. This visualization eliminates ambiguity, clarifying the interaction pathways and dependencies that shape performance outcomes.
Intelligent Alerting and Event Correlation
AppDynamics’ alerting system operates on a foundation of contextual intelligence. Alerts are not merely generated when a metric crosses a static threshold; they are derived from patterns, baselines, and event relationships.
Each alert correlates multiple data points to ensure relevance. For example, a spike in response time might not trigger an alert if it coincides with a planned maintenance window. Conversely, if the same spike occurs outside of expected conditions, the system classifies it as a critical event and notifies the relevant personnel.
This event correlation prevents alert fatigue—a common challenge in large-scale monitoring environments—by ensuring that only meaningful notifications reach analysts. Alerts can also trigger automated remediation workflows, such as restarting a service, clearing a cache, or reallocating resources. These automated responses reduce downtime and free analysts to focus on strategic optimization.
Data Interpretation and Performance Intelligence
Data interpretation in AppDynamics is both an art and a science. The platform presents raw metrics, but it is the analyst’s responsibility to interpret them within operational context. Effective interpretation requires an understanding of baselines, dependencies, and system dynamics.
Performance analysts use dashboards, graphs, and reports to discern trends and correlations. For example, a gradual increase in response time across multiple tiers may indicate cumulative latency, while fluctuating throughput could point to load balancing inefficiencies. By examining data patterns over time, analysts can distinguish between transient anomalies and systemic issues.
AppDynamics enhances interpretation through machine learning algorithms that highlight statistically significant deviations. These insights enable analysts to focus their efforts on meaningful anomalies rather than noise.
Proactive Performance Management
The ultimate objective of performance analysis is not just to fix problems but to prevent them altogether. Proactive management is achieved by combining continuous monitoring, predictive analytics, and automated optimization.
AppDynamics empowers organizations to implement predictive strategies by analyzing historical data and identifying patterns that precede performance degradation. For instance, the system might detect that certain transaction paths tend to slow down when database query counts exceed a specific threshold. Armed with this knowledge, analysts can optimize queries or adjust resource allocation before the issue manifests.
Automated baselining further strengthens proactive management by allowing performance thresholds to evolve with changing workloads. This adaptability ensures that monitoring remains precise even in fluctuating environments.
Additionally, AppDynamics supports scheduled health checks, synthetic monitoring, and anomaly prediction, all of which contribute to maintaining system stability and reliability.
The Importance of Continuous Optimization
Optimization in AppDynamics is an iterative process. After resolving an issue or implementing a change, analysts must evaluate its impact on overall performance. Continuous feedback loops ensure that improvements are measurable, sustainable, and aligned with business objectives.
AppDynamics facilitates this process through customizable reports and visual analytics. Analysts can compare pre- and post-optimization metrics to assess the effectiveness of interventions. Over time, these insights contribute to a growing repository of organizational knowledge, refining performance management strategies.
Optimization also extends to configuration tuning, capacity planning, and code refinement. By identifying recurring performance patterns, organizations can make strategic adjustments that enhance scalability and reduce operational costs.
The Intersection of Automation and Human Insight
While automation plays a critical role in modern performance management, it cannot entirely replace human intuition and analytical reasoning. AppDynamics exemplifies the balance between machine precision and human expertise.
Automated alerts, baselining, and anomaly detection streamline monitoring processes, allowing analysts to focus on interpretation and strategy. However, it is human discernment that transforms data into meaningful insight. The best outcomes arise when automation handles repetitive tasks, and analysts direct their cognitive abilities toward innovation and foresight.
This synergy ensures that AppDynamics functions not merely as a monitoring tool but as an extension of human analytical capability—augmenting perception, reducing cognitive load, and enhancing decision-making accuracy.
Integrating AppDynamics into Organizational Strategy
For organizations, integrating AppDynamics into the broader operational framework is essential for maximizing its value. This integration involves aligning monitoring practices with business objectives, defining key performance indicators, and fostering collaboration across teams.
AppDynamics provides visibility that extends beyond IT operations. Business leaders can use its insights to understand how technical performance affects customer engagement, conversion rates, and overall productivity. This alignment fosters a culture of performance awareness throughout the organization.
Moreover, the data-driven insights from AppDynamics can inform capacity planning, risk management, and strategic decision-making. By transforming performance intelligence into actionable business metrics, organizations gain the ability to anticipate challenges, manage costs, and sustain long-term resilience.
Understanding the Essence of the Cisco 500-420 CAAPA Examination
The Cisco AppDynamics Associate Performance Analyst exam is not designed merely to test memorization; it seeks to measure a candidate’s ability to think critically and apply theoretical understanding to practical scenarios. The exam’s core purpose is to validate the professional’s competence in monitoring, analyzing, and improving application performance using the AppDynamics platform.
Comprising 55 to 65 questions, the examination spans a duration of 90 minutes. Each question requires not just recall of knowledge but analytical evaluation of system behaviors, configurations, and optimization strategies. The cost of registration is set at 300 USD, reflecting its value as a professional benchmark within the global performance monitoring community.
The exam’s structure mirrors the operational realities of AppDynamics deployment. It challenges candidates to approach situations as performance analysts—interpreting data, correlating anomalies, and determining root causes. Success depends upon more than isolated knowledge; it requires a holistic understanding of how different AppDynamics components interact to deliver coherent performance insight.
Core Domains of Knowledge
To achieve excellence in the Cisco 500-420 CAAPA exam, candidates must develop mastery across its defined domains. Each domain represents a dimension of performance analysis, collectively forming a comprehensive body of knowledge.
1. Agents and Application Performance (20%)
This domain evaluates understanding of agent configuration, deployment, and functionality. Candidates must comprehend how different agents—application, machine, database, and browser—interact to collect performance metrics. They should understand how agents influence data accuracy, coverage, and correlation within the monitoring ecosystem.
2. Troubleshooting (15%)
The troubleshooting section tests the ability to diagnose complex performance issues. Candidates are expected to interpret flow maps, analyze transaction snapshots, evaluate health rules, and identify underlying causes of anomalies. This portion assesses a professional’s problem-solving methodology, logical reasoning, and situational awareness.
3. Business Transactions (20%)
Here, the focus lies on understanding how AppDynamics models user interactions as business transactions. Candidates must grasp transaction detection, correlation, and baselining. Knowledge of transaction snapshots, performance thresholds, and flow visualization is critical.
4. Health Rules, Dashboards, and Snapshots (20%)
This domain measures expertise in creating health rules, designing dashboards, and utilizing snapshots for diagnostic and analytical purposes. Candidates must demonstrate an ability to visualize complex data sets and translate them into actionable insights.
5. Collectors, Information Points, and Service Endpoints (25%)
The final domain encompasses the mechanisms through which AppDynamics gathers data from applications, databases, and external systems. Understanding how collectors and service endpoints facilitate deep transaction tracing and performance correlation is essential.
Together, these domains establish the intellectual architecture of the exam, reflecting the multifaceted nature of application performance management.
Developing the Analytical Mindset
Preparation for the Cisco 500-420 CAAPA exam begins not with study materials but with cultivating the appropriate analytical mindset. Performance analysis is a discipline of curiosity, observation, and pattern recognition. A proficient analyst must learn to interpret subtle signals hidden within complex data landscapes.
Developing this mindset involves learning to connect disparate pieces of information into a cohesive narrative. For instance, a candidate must be able to infer that an increase in response time might not stem solely from application inefficiency but could relate to database contention or network latency. Such reasoning transforms static data into dynamic insight.
In the context of exam preparation, this mindset translates into studying with comprehension rather than memorization. Understanding how and why AppDynamics performs certain actions is far more valuable than recalling isolated definitions.
Comprehensive Study Strategies for Mastery
Achieving excellence in the Cisco AppDynamics Associate Performance Analyst certification requires structured preparation that integrates conceptual learning, practical application, and continuous reinforcement.
1. Constructing a Study Framework
Begin by dividing the syllabus into manageable segments based on the core domains. Establish a timeline that allocates specific periods for each domain, ensuring consistent progress. It is vital to balance theoretical study with hands-on experimentation to reinforce conceptual clarity.
2. Utilizing Official Cisco Resources
Cisco’s official documentation provides the most authoritative insight into AppDynamics operations. This includes product manuals, feature explanations, and configuration guidelines. These resources ensure alignment with Cisco’s standards, terminology, and best practices.
3. Engaging in Hands-On Labs
Theory without practice remains incomplete. Setting up a controlled AppDynamics environment allows candidates to observe real-world data flows and performance metrics. Experimentation with health rules, baselines, and snapshots develops practical intuition, which is indispensable during the exam.
4. Reinforcing Learning Through Practice Tests
Simulated exams replicate the pressure and complexity of the actual test. By attempting multiple practice assessments, candidates can identify weak areas and measure their readiness. Each incorrect answer offers an opportunity for deeper exploration.
5. Collaborative Learning
Participating in study groups or professional communities fosters shared understanding. Discussing scenarios, exchanging experiences, and debating interpretations enrich conceptual depth. Collaboration also mirrors the real-world dynamics of performance management, where teamwork is fundamental.
Building Technical Proficiency
Technical proficiency in AppDynamics involves mastering both the operational and conceptual dimensions of the platform. Candidates must become fluent in deploying agents, defining health rules, and navigating dashboards.
Proficiency also extends to interpreting metrics such as throughput, latency, error rates, and resource utilization. Understanding how these metrics interact forms the foundation of accurate performance assessment.
Practical exercises should include simulating common performance issues, such as high memory usage or slow database queries, and using AppDynamics tools to isolate and resolve them. This experiential learning strengthens diagnostic capability and reinforces theoretical concepts.
The Significance of Data Interpretation in the Exam Context
While technical accuracy is essential, the Cisco 500-420 CAAPA exam places equal emphasis on the candidate’s ability to interpret performance data. Data interpretation involves recognizing relationships among metrics and determining their implications for system health.
For example, if a dashboard indicates rising response times accompanied by stable throughput, it suggests latency within a specific service tier. Conversely, if both response time and throughput decline simultaneously, the root cause may involve network constraints or resource contention.
By practicing such interpretive analysis, candidates sharpen their ability to approach exam questions methodically and draw logical conclusions under time constraints.
Time Management and Exam Strategy
The 90-minute duration of the exam demands efficient time management. Candidates must balance speed with precision, avoiding excessive focus on any single question. A strategic approach involves scanning through all questions initially, addressing straightforward ones first, and revisiting complex scenarios afterward.
AppDynamics-related scenarios often involve layered information—charts, metrics, or short case studies. Reading carefully and identifying key indicators ensures that responses remain accurate.
Candidates should also remain aware that not every question demands in-depth computation; some require identifying correct conceptual relationships. Developing the ability to discern question intent significantly improves efficiency.
The Role of Simulated Environments in Preparation
Setting up a simulated AppDynamics environment enables candidates to experience real-world dynamics of monitoring and analysis. Through such environments, one can explore business transactions, generate synthetic load, and observe system behavior in response to varying conditions.
This hands-on exposure nurtures an understanding of cause-and-effect relationships, bridging the gap between theory and practice. Candidates who spend time experimenting with configurations, alerts, and visualizations are often better equipped to interpret the situational context presented in exam questions.
Cultivating Cognitive Endurance
Beyond technical mastery, the Cisco 500-420 CAAPA exam tests mental endurance. Sustained concentration across 90 minutes of analytical questioning requires preparation of the mind as much as of knowledge.
Regular timed practice sessions train the brain to maintain focus and decision-making clarity under pressure. Cognitive endurance ensures that candidates remain methodical even when facing complex or unfamiliar scenarios.
A calm, structured approach to problem-solving often distinguishes high-performing candidates from those who rely purely on rote memorization.
The Importance of Reflection and Continuous Learning
After each study session, reflection consolidates learning. Candidates should summarize key takeaways, identify areas requiring reinforcement, and re-evaluate their study plan accordingly. Reflection transforms passive study into active comprehension.
Continuous learning also implies staying abreast of evolving features within AppDynamics. As Cisco continuously enhances its monitoring capabilities, understanding recent updates ensures relevance and adaptability.
Beyond Certification: The Professional Value of Mastery
Achieving certification as a Cisco AppDynamics Associate Performance Analyst extends beyond credentials—it signifies transformation into a professional capable of contributing tangible value to organizational success.
Certified professionals possess the analytical acumen to identify inefficiencies, improve user experiences, and enhance system resilience. Their expertise influences operational decisions, guiding teams toward sustainable performance optimization.
This certification also strengthens collaboration between departments. A certified analyst can communicate effectively with developers, operations personnel, and business managers, bridging technical detail with strategic objectives.
The Future of Application Performance Intelligence: Advancing Beyond Certification and Embracing Analytical Evolution
In the expanding universe of digital transformation, performance intelligence has evolved from a reactive function into a fundamental discipline of strategic foresight. The Cisco AppDynamics Associate Performance Analyst certification stands as a hallmark of this progression, uniting human reasoning with technological precision. Yet, earning this certification represents not an endpoint, but the beginning of a deeper journey—one that involves continuous adaptation, analytical maturity, and an enduring pursuit of operational excellence.
The Continuing Journey Beyond Certification
Attaining certification as a Cisco AppDynamics Associate Performance Analyst is an achievement rooted in intellectual dedication and technical competence. However, true mastery extends beyond passing an examination—it requires continuous learning and the integration of analytical principles into daily practice.
In dynamic enterprise environments, applications evolve constantly through updates, integrations, and new service architectures. Each transformation introduces novel variables that can influence performance outcomes. Thus, the certified professional must adopt a mindset of perpetual learning, refining analytical strategies in response to technological advancements.
The process of staying current involves exploring updated AppDynamics functionalities, revisiting monitoring configurations, and reassessing baseline definitions as systems mature. As organizations increasingly transition toward hybrid and cloud-native infrastructures, analysts must also develop expertise in container orchestration, microservices, and distributed tracing methodologies.
By expanding their understanding in these areas, certified professionals transform into adaptive strategists who ensure that performance management remains aligned with business growth.
The Role of Continuous Monitoring in an Evolving Landscape
Continuous monitoring has emerged as a cornerstone of digital reliability. Within the AppDynamics ecosystem, it encompasses real-time observation of applications, infrastructure, and user experience. This ongoing vigilance allows organizations to detect anomalies the instant they arise, preserving stability and trust.
Continuous monitoring differs fundamentally from periodic assessment. It demands persistent attention and dynamic analysis—tracking not just what has occurred, but what is likely to occur. This shift from reactive maintenance to proactive foresight defines the evolution of performance intelligence.
AppDynamics facilitates this transformation through automated baselining and adaptive alerting mechanisms. Its intelligent analytics continuously recalibrate thresholds based on observed patterns, ensuring monitoring accuracy even amid shifting workloads. This adaptability embodies the future of performance management—systems that learn from their environment, interpret trends, and guide decisions autonomously.
Integrating AppDynamics into Holistic IT Ecosystems
In the modern enterprise, application performance monitoring cannot exist in isolation. It must integrate seamlessly with other facets of information technology—security, automation, and service delivery. AppDynamics provides the analytical foundation that bridges these domains.
By correlating performance metrics with security telemetry, organizations can detect patterns that indicate potential vulnerabilities or misconfigurations. Integration with automation frameworks enables proactive remediation, ensuring that identified issues trigger immediate corrective actions.
For instance, when AppDynamics detects a transaction anomaly caused by memory exhaustion, integration with orchestration platforms can automatically scale resources or restart affected services. This synergy reduces human intervention, accelerates recovery, and enhances operational consistency.
Such integrations highlight a broader truth: performance intelligence is not confined to individual applications but extends across the organizational digital fabric. Every process, from customer interaction to data processing, is interconnected—and AppDynamics provides the visibility necessary to maintain equilibrium across this complex web.
Analytical Leadership in the Era of Observability
The evolution of performance analysis is converging with the emerging discipline of observability—a paradigm that emphasizes comprehensive insight into systems through metrics, traces, and logs. While monitoring answers “what” is happening, observability explains “why” it is happening.
Certified AppDynamics professionals are uniquely positioned to lead this transition. Their expertise in tracing business transactions, interpreting anomalies, and correlating data provides the foundation for building observable systems. By extending AppDynamics insights into observability frameworks, analysts contribute to the creation of digital ecosystems where transparency, causality, and foresight coexist.
Analytical leadership in this era requires the ability to interpret vast data streams and extract meaningful narratives. AppDynamics equips professionals with these capabilities through its visual analytics, predictive algorithms, and business transaction modeling. When applied strategically, these insights drive not only system optimization but organizational transformation.
The Convergence of Artificial Intelligence and Application Monitoring
Artificial intelligence (AI) continues to redefine the boundaries of performance intelligence. Within AppDynamics, machine learning algorithms already analyze patterns, detect anomalies, and forecast performance trends. The next frontier lies in expanding these capabilities into prescriptive intelligence—systems that not only predict issues but recommend precise actions to prevent them.
The integration of AI with AppDynamics transforms traditional monitoring into cognitive performance management. Systems evolve from passive observers to active participants capable of self-correction and optimization. Analysts, in turn, transition from problem-solvers to decision architects, guiding automated systems with strategic oversight.
This convergence also enhances scalability. As digital infrastructures grow in complexity, human analysts alone cannot process every data point. AI augmentation ensures that insights remain accurate and timely, allowing professionals to focus on interpreting outcomes rather than sifting through endless streams of information.
The Ethical Imperatives of Data Intelligence
As performance analysis grows increasingly data-driven, ethical considerations assume paramount importance. AppDynamics provides vast visibility into application operations, user interactions, and infrastructure behaviors. With such insight comes the responsibility to manage data ethically and transparently.
Ethical practice in performance management involves safeguarding privacy, ensuring data accuracy, and using insights responsibly. Analysts must maintain integrity in interpreting results—avoiding manipulation of metrics to create favorable impressions. Decisions derived from performance data should always align with organizational ethics and compliance requirements.
Furthermore, as AI-driven analytics become more pervasive, professionals must ensure algorithmic transparency. Understanding how predictive models derive conclusions preserves accountability and trust. Ethical stewardship ensures that performance intelligence enhances human decision-making without compromising fairness or reliability.
Transforming Performance Intelligence into Strategic Advantage
Performance intelligence is not solely a technical discipline—it is a strategic enabler that influences competitive positioning, customer satisfaction, and innovation velocity. Organizations that harness AppDynamics insights effectively gain a profound advantage in the digital marketplace.
By correlating performance metrics with business outcomes, enterprises can quantify the impact of optimization on user experience and revenue. For instance, reducing transaction latency can directly enhance conversion rates in online commerce or streamline operational workflows in service-oriented industries.
This measurable link between performance and profitability transforms performance management from a background function into a strategic driver. Executives increasingly rely on AppDynamics dashboards to make data-informed decisions, aligning technical efficiency with organizational goals.
Certified professionals, therefore, become not merely analysts but strategic contributors—translating technical insight into executive intelligence. Their understanding of application behavior and systemic interdependence empowers them to advise leadership on scaling strategies, investment priorities, and innovation initiatives.
Lifelong Learning and the Evolution of Expertise
In the world of digital performance, stagnation equates to obsolescence. The continuous evolution of technology demands that professionals evolve alongside it. Lifelong learning thus becomes the sustaining principle of performance expertise.
Cisco’s AppDynamics ecosystem evolves regularly, incorporating new analytical models, visualization techniques, and integration capabilities. Certified analysts must commit to exploring these enhancements to maintain relevance and authority in their field.
Beyond platform updates, professionals benefit from expanding their horizons into adjacent disciplines—cloud architecture, DevOps automation, cybersecurity analytics, and business process intelligence. These areas enrich analytical perspective, allowing performance data to be interpreted through broader organizational contexts.
Through deliberate learning, professionals cultivate adaptability, enabling them to manage the unpredictability of technological evolution with confidence and insight.
The Human Element in an Automated Future
Automation, artificial intelligence, and predictive analytics may dominate the technological landscape, but the human element remains indispensable. Even as systems grow more autonomous, it is human judgment that provides meaning, empathy, and ethical grounding to machine-generated insights.
AppDynamics empowers analysts with sophisticated tools, but it is the analyst’s discernment that transforms those tools into instruments of understanding. The ability to interpret ambiguity, recognize contextual subtleties, and anticipate user behavior remains uniquely human.
In the future of application performance intelligence, human analysts will not compete with automation but will collaborate with it. This collaboration transforms performance management into a symbiotic relationship where technology enhances human potential rather than replacing it.
Global Recognition and Professional Identity
The Cisco AppDynamics Associate Performance Analyst certification bestows global recognition upon those who achieve it. It represents a universal standard of analytical competence, respected across industries and geographies.
Professionals who hold this certification belong to a distinguished network of experts dedicated to advancing the discipline of performance management. This recognition carries both prestige and responsibility—the obligation to uphold excellence, share knowledge, and mentor emerging analysts.
In a professional landscape increasingly defined by digital performance, certified analysts stand as ambassadors of analytical integrity and innovation. Their expertise contributes not only to organizational success but to the broader advancement of performance intelligence as a discipline.
Envisioning the Future of AppDynamics and Performance Analysis
As technology continues to evolve, AppDynamics is poised to remain a central pillar in the architecture of performance intelligence. Emerging trends—such as distributed tracing for microservices, predictive maintenance through AI, and end-to-end observability—will redefine how performance is measured and managed.
AppDynamics will continue integrating with cloud-native ecosystems, IoT infrastructures, and edge computing frameworks, providing unified visibility across increasingly fragmented environments. These developments will demand new analytical paradigms, blending real-time data interpretation with strategic prediction.
For professionals, this evolution presents both challenge and opportunity. Those who adapt swiftly, expand their analytical repertoire, and embrace new technologies will lead the next generation of performance intelligence.
The Philosophical Dimension of Performance Management
Beyond its technical mechanisms, performance management embodies a philosophical principle: the pursuit of harmony between systems, users, and objectives. Each monitored transaction represents an interaction between technology and human experience. Ensuring that these interactions remain efficient and seamless is a form of digital craftsmanship.
AppDynamics symbolizes this philosophy by transforming raw data into insight, chaos into order, and complexity into clarity. The certified analyst becomes both a technician and a philosopher—balancing logic with perception, measurement with intuition, and precision with empathy. This synthesis reflects the true essence of performance mastery: understanding not only how systems function but why their performance matters to the people and processes they serve.
Conclusion
The evolution of application performance management reflects the transformation of technology from a functional necessity into a strategic discipline that defines modern enterprise success. The Cisco AppDynamics Associate Performance Analyst certification embodies this evolution, merging analytical rigor with technological precision. Through mastering the principles of performance monitoring, optimization, and diagnostic intelligence, professionals gain the capacity to ensure reliability, efficiency, and adaptability within complex digital ecosystems. AppDynamics serves as both a tool and a philosophy—empowering analysts to perceive beyond data and interpret the dynamics that drive system behavior. The certification signifies more than technical achievement; it represents a commitment to continuous learning, ethical analysis, and the pursuit of excellence in digital performance. As technology advances through automation, artificial intelligence, and cloud-native architectures, the human element remains indispensable. The insight, judgment, and interpretive depth of a skilled analyst transform metrics into meaning and challenges into innovation. Ultimately, the mastery of AppDynamics and the principles of performance analysis foster a culture of foresight and resilience. Professionals who embrace this discipline contribute not only to operational stability but also to strategic growth and innovation. The certification journey, therefore, is not a final milestone but an enduring vocation—a continuous endeavor to harmonize technology with purpose, ensuring that every digital interaction reflects precision, reliability, and intelligence in an ever-evolving technological landscape.
Frequently Asked Questions
Where can I download my products after I have completed the purchase?
Your products are available immediately after you have made the payment. You can download them from your Member's Area. Right after your purchase has been confirmed, the website will transfer you to Member's Area. All you will have to do is login and download the products you have purchased to your computer.
How long will my product be valid?
All Testking products are valid for 90 days from the date of purchase. These 90 days also cover updates that may come in during this time. This includes new questions, updates and changes by our editing team and more. These updates will be automatically downloaded to computer to make sure that you get the most updated version of your exam preparation materials.
How can I renew my products after the expiry date? Or do I need to purchase it again?
When your product expires after the 90 days, you don't need to purchase it again. Instead, you should head to your Member's Area, where there is an option of renewing your products with a 30% discount.
Please keep in mind that you need to renew your product to continue using it after the expiry date.
How often do you update the questions?
Testking strives to provide you with the latest questions in every exam pool. Therefore, updates in our exams/questions will depend on the changes provided by original vendors. We update our products as soon as we know of the change introduced, and have it confirmed by our team of experts.
How many computers I can download Testking software on?
You can download your Testking products on the maximum number of 2 (two) computers/devices. To use the software on more than 2 machines, you need to purchase an additional subscription which can be easily done on the website. Please email support@testking.com if you need to use more than 5 (five) computers.
What operating systems are supported by your Testing Engine software?
Our testing engine is supported by all modern Windows editions, Android and iPhone/iPad versions. Mac and IOS versions of the software are now being developed. Please stay tuned for updates if you're interested in Mac and IOS versions of Testking software.