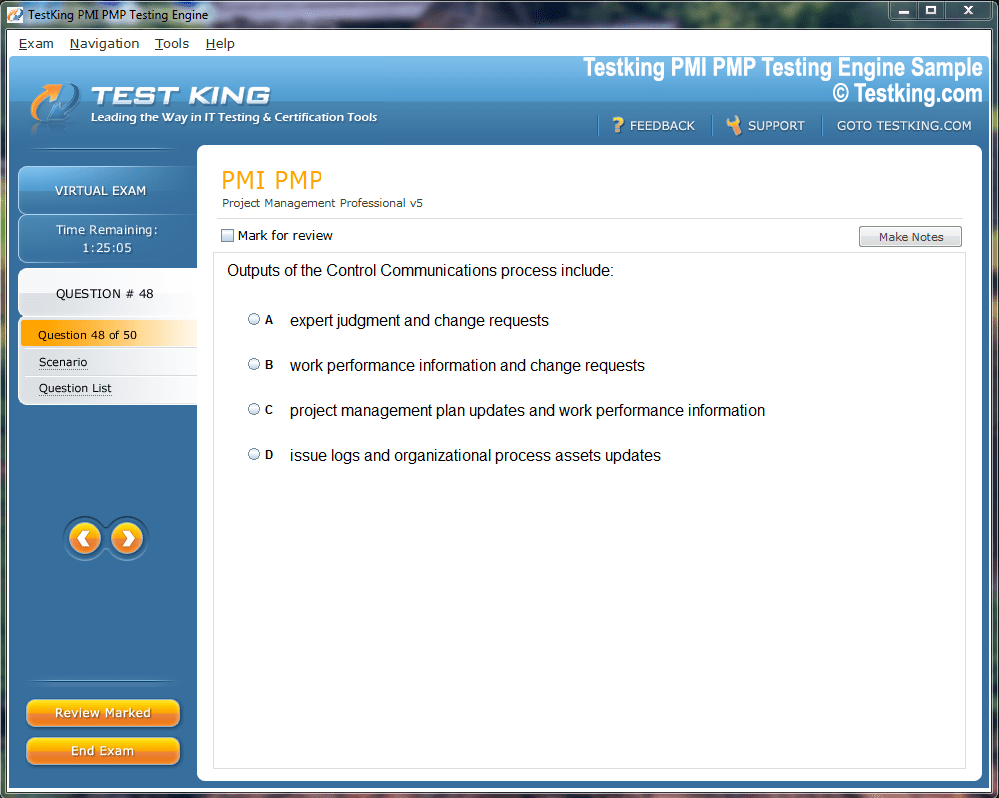
Product Screenshots
Frequently Asked Questions
Where can I download my products after I have completed the purchase?
Your products are available immediately after you have made the payment. You can download them from your Member's Area. Right after your purchase has been confirmed, the website will transfer you to Member's Area. All you will have to do is login and download the products you have purchased to your computer.
How long will my product be valid?
All Testking products are valid for 90 days from the date of purchase. These 90 days also cover updates that may come in during this time. This includes new questions, updates and changes by our editing team and more. These updates will be automatically downloaded to computer to make sure that you get the most updated version of your exam preparation materials.
How can I renew my products after the expiry date? Or do I need to purchase it again?
When your product expires after the 90 days, you don't need to purchase it again. Instead, you should head to your Member's Area, where there is an option of renewing your products with a 30% discount.
Please keep in mind that you need to renew your product to continue using it after the expiry date.
How many computers I can download Testking software on?
You can download your Testking products on the maximum number of 2 (two) computers/devices. To use the software on more than 2 machines, you need to purchase an additional subscription which can be easily done on the website. Please email support@testking.com if you need to use more than 5 (five) computers.
What operating systems are supported by your Testing Engine software?
Our NPM testing engine is supported by all modern Windows editions, Android and iPhone/iPad versions. Mac and IOS versions of the software are now being developed. Please stay tuned for updates if you're interested in Mac and IOS versions of Testking software.
Top SolarWinds Exams
SolarWinds NPM Advanced Insights for IT Professionals
In contemporary IT operations, the subtlety of unseen problems can be more perilous than the issues themselves. Many network administrators have experienced that unnerving sensation of staring at a monitoring dashboard and realizing that an anomaly exists, but its precise nature remains elusive. This uncertainty is particularly pronounced in organizations that manage sprawling, multi-site networks or operate with lean IT teams. In such environments, the absence of granular visibility is not merely inconvenient; it can cascade into operational risk, financial loss, and reputational damage.
The root of these challenges is seldom a deficiency in talent. Highly skilled engineers and administrators frequently find themselves constrained by insufficient insight into the network’s behavior. What distinguishes effective IT organizations from those perpetually in reactive mode is the adoption of visibility not as a mere feature of software, but as a deliberate strategy integrated across the entire technology ecosystem.
A comprehensive approach to visibility begins with deploying a meticulously configured network performance monitoring system. When coupled with supporting modules that provide traffic analysis, application monitoring, and configuration management, this infrastructure evolves into a cohesive mechanism capable of translating data into actionable intelligence. By systematically addressing visibility, organizations can shift from reactive firefighting to proactive oversight, reducing mean time to resolution and improving overall system reliability.
Defining the Scope of End-to-End Visibility
The terminology surrounding network visibility is often nebulous, peppered with marketing-driven descriptors such as “full stack monitoring,” “360-degree oversight,” and “end-to-end supply chain intelligence.” While these terms are prevalent in industry literature, their practical meaning is more precise. True end-to-end visibility encompasses the ability to detect where issues arise, understand their root cause, evaluate their impact on users and systems, and prescribe corrective measures.
This vision of visibility extends from peripheral edge devices through the core of data centers, encompassing servers, network switches, applications, and the underlying configurations that govern their behavior. Only when monitoring spans these interconnected layers can administrators interpret patterns, preempt disruptions, and maintain service continuity. A properly implemented monitoring environment not only tracks operational metrics but also contextualizes them, revealing the subtle interdependencies that might otherwise remain hidden.
The philosophy behind this approach is straightforward: data without interpretation is inert. A system that merely signals alerts without correlating them across network segments or application layers leaves administrators guessing. By designing a monitoring ecosystem that integrates network performance data, traffic analytics, server metrics, and configuration information, organizations cultivate a holistic perspective that transforms raw signals into predictive intelligence.
Common Obstacles to Achieving Visibility
Even with licensed network monitoring tools, many organizations fail to realize their potential due to what can be described as the “tool sprawl phenomenon.” This occurs when monitoring solutions are deployed without a cohesive strategy, resulting in fragmented insights and underutilized capabilities. In practice, this manifests in several ways:
Network performance monitors are installed with default settings, limiting their ability to detect nuanced anomalies.
Traffic analysis tools are either disabled or misconfigured, leaving bandwidth and protocol-level usage largely invisible.
Configuration management systems are deployed without automated backup schedules or compliance oversight, creating silent vulnerabilities.
Dashboards are populated with disparate metrics but lacking interpretive clarity, rendering them effectively unreadable.
Help desk teams operating without visibility into infrastructure events, relying solely on user-reported symptoms.
Log files are accumulated but rarely analyzed, squandering the potential intelligence they contain.
Without a deliberate monitoring plan, these tools remain underexploited. The transformation from a passive instrument to a strategic asset requires intentional configuration, cross-module integration, and ongoing stewardship. A mature monitoring strategy transforms disparate software into a dynamic system that provides actionable insights, aligning operational processes with business objectives and ensuring continuity of service.
Core Components of a Comprehensive Monitoring Ecosystem
End-to-end visibility demands an integrated suite of tools, each contributing a specific dimension of insight while complementing the others. The central element is a network performance monitoring system capable of tracking device health, latency, uptime, and interface performance. Beyond simply signaling failures, such a system provides topology mapping, historical baselines, and customizable alerting thresholds, enabling administrators to anticipate anomalies before they impact operations.
Traffic analysis modules are equally vital. Understanding how data flows through the network, identifying bandwidth-intensive applications, and detecting anomalous patterns allows administrators to translate generalized complaints of sluggish performance into precise diagnoses. By monitoring protocol-level usage and flow distribution, organizations can identify bottlenecks and implement targeted remediation strategies.
Application monitoring provides a critical layer of granularity, distinguishing network-induced latency from application-specific performance issues. By observing server resource utilization, service uptime, and transaction metrics, monitoring frameworks can isolate slowdowns to their root causes, ensuring that remediation efforts are directed appropriately and efficiently.
Configuration management complements performance and traffic monitoring by tracking changes to network and system configurations, enforcing policy compliance, and maintaining automated backups. This function is essential for preventing configuration drift, unauthorized modifications, and silent failures. In practice, a configuration management module acts as both a safeguard and a diagnostic tool, linking operational anomalies to specific configuration changes and enabling rapid remediation through rollback mechanisms.
Additional supporting tools enhance wireless visibility, syslog management, and centralized event correlation. Wireless analyzers provide insight into coverage gaps, access point performance, and rogue device activity. Log aggregation and event management systems ensure that operational intelligence is captured, filtered, and correlated, offering administrators a proactive lens on potential failures before they affect users. When these components are unified under a common platform, the result is a coherent, multi-dimensional perspective on infrastructure health and behavior.
Crafting Dashboards That Convey Meaning
Dashboards are often perceived as passive displays, yet their true value lies in narrative construction. A well-designed dashboard communicates the story of the network, translating disparate metrics into a coherent depiction of system health, performance, and risk.
Effective dashboards segment information into thematic layers, each aligned with operational objectives. A user experience layer might track latency, transaction completion, and synthetic performance metrics, offering a perspective on how end users interact with the system. The network layer presents real-time node status, interface utilization, traffic flow insights, and topology visualizations, revealing interdependencies and potential bottlenecks.
Application-specific layers focus on memory usage, CPU consumption, service uptime, database query performance, and log event summaries pertinent to critical services. Configuration awareness layers provide transparency into change management, compliance enforcement, and rollback triggers, while log intelligence layers synthesize syslog data, event correlations, and historical trends to support forensic analysis and trend identification.
By organizing dashboards in this manner, administrators can move seamlessly from symptom observation to root cause identification, interpreting complex interactions without cognitive overload. This approach converts monitoring from a reactive, piecemeal activity into a strategic capability, enabling organizations to anticipate disruptions and optimize operational performance.
Case Example: From Obscurity to Operational Clarity
Consider a global manufacturer experiencing intermittent ERP system timeouts despite deploying a variety of monitoring tools. Although the organization had network performance monitors, configuration management modules, and basic help desk infrastructure, persistent service interruptions indicated a gap in end-to-end visibility.
Detailed examination revealed multiple contributing factors. Network monitoring detected packet loss at core switches without providing context for the cause. Configuration management logs exposed partially failed firmware upgrades, while traffic analysis identified resource-intensive backup processes occurring during peak operational hours. Application monitoring further highlighted recurring database query latency, particularly at predictable intervals each morning.
Addressing these issues required coordinated adjustments across the monitoring stack. Configuration management schedules were revised to include nightly backups and automated compliance checks. Performance thresholds were refined using historical baselines to reduce false alerts and improve sensitivity to genuine anomalies. Traffic flows were segmented to prioritize mission-critical applications, ensuring that background processes did not impact operational performance. Dashboards were redesigned to present actionable insights to operations teams, application owners, and executives, correlating logs, configuration changes, and alerts into a coherent narrative.
The outcomes were substantial. Mean time to resolution decreased significantly, support ticket volume dropped, and leadership gained visibility into operational status without requiring technical expertise. Compliance reporting proactively flagged unauthorized modifications, preventing potential incidents. This scenario illustrates the transformative effect of integrated monitoring, configuration management, and traffic analysis when deployed as part of a deliberate visibility strategy.
Strategic Implications for IT Leadership
End-to-end visibility is not solely a technical concern; it represents a strategic lever for leadership. CIOs, IT directors, and infrastructure managers who embrace visibility gain several advantages, including control over service-level agreements, predictable system uptime, defensible budget allocations, and credibility with stakeholders.
When visibility is embedded in organizational processes, operational risks are mitigated, planning becomes more reliable, and problem resolution transitions from reactive triage to anticipatory management. Leadership can identify trends, allocate resources efficiently, and make informed decisions regarding capacity planning, vendor negotiations, and risk management. The ability to see across the entire infrastructure landscape translates into both operational resilience and strategic agility.
Moreover, visibility reduces the financial and reputational costs associated with unanticipated outages. Each incident avoided or resolved more quickly represents a tangible return on investment, often exceeding the expenditure associated with licensing, deploying, and maintaining a comprehensive monitoring environment. From this perspective, visibility is both a protective measure and a catalyst for organizational efficiency.
The Anatomy of Network Monitoring for Complete Oversight
In contemporary IT operations, the sophistication of a network often belies the complexity of its management. Administrators are confronted with devices, applications, and configurations that span multiple sites, cloud services, and hybrid environments. In such contexts, partial visibility is insufficient. True operational oversight demands a structured monitoring framework capable of tracking metrics across every layer of the infrastructure, from edge devices to core data centers and from configuration changes to end-user experience.
A well-implemented network monitoring system functions as the nervous system of the IT environment, transmitting real-time signals about device health, connectivity, application performance, and traffic behavior. By capturing these signals systematically, administrators gain the ability to detect anomalies early, correlate events across domains, and prioritize interventions. This capacity transforms monitoring from a reactive instrument into a predictive and strategic function, providing both operational clarity and risk mitigation.
Foundational Principles of End-to-End Monitoring
End-to-end monitoring is grounded in several foundational principles that guide the design and deployment of an effective visibility strategy. First, data collection must be comprehensive, capturing metrics from diverse sources, including network interfaces, servers, applications, and configuration repositories. Incomplete data streams create blind spots that can obscure the root cause of incidents and hinder timely resolution.
Second, monitoring must be contextually aware. Raw metrics are insufficient; administrators require correlation and interpretation to discern meaningful patterns. Latency spikes, for example, are only actionable when linked to specific applications, devices, or user groups. Similarly, configuration changes must be tracked and analyzed in conjunction with performance metrics to understand their operational impact.
Third, dashboards and visualization layers must be thoughtfully designed. A well-constructed dashboard translates complex, multi-layered data into an intuitive narrative, highlighting critical issues while enabling exploration of deeper correlations. Without narrative clarity, the wealth of collected metrics risks becoming noise, reducing both efficiency and situational awareness.
Finally, ongoing maintenance and iterative refinement are essential. Monitoring environments are not static; network expansions, application updates, and evolving user behaviors necessitate continuous calibration of alerts, thresholds, and performance baselines. Organizations that neglect this dynamic adjustment expose themselves to both false positives and undetected anomalies.
Components of a Robust Monitoring Framework
A comprehensive monitoring framework integrates multiple complementary modules, each providing a distinct lens on operational health while contributing to a unified view. The core of this framework is a network performance monitoring system. This module continuously measures device health, interface utilization, latency, and availability, generating baseline metrics that inform alert thresholds and capacity planning. Topology mapping and visual representation of network dependencies allow administrators to trace the impact of anomalies and identify potential points of failure.
Traffic analysis modules enhance this perspective by providing granular insight into bandwidth consumption, protocol distribution, and anomalous flows. Without traffic visibility, vague complaints about sluggish performance cannot be accurately diagnosed, leaving administrators reliant on speculation. By monitoring traffic patterns and identifying bandwidth-intensive processes, these tools facilitate informed intervention, ensuring that critical business applications receive appropriate network resources.
Application monitoring introduces a layer of granularity that distinguishes network-induced slowness from application-specific performance issues. By tracking service uptime, database queries, memory and CPU utilization, and transaction latency, administrators can identify bottlenecks, optimize resource allocation, and reduce mean time to resolution. Integration of application metrics with network and configuration data creates a multidimensional perspective that strengthens both troubleshooting and predictive analysis.
Configuration management is equally vital. Systems evolve continuously through software updates, patches, and manual changes, creating potential for configuration drift, unauthorized modifications, and silent failures. Configuration management tools track these changes, maintain automated backups, enforce policy compliance, and enable rapid rollback. When an anomaly is detected, configuration logs provide insight into who made changes, what was altered, and when the modification occurred, linking operational disruptions to specific actions.
Additional components, including wireless analysis and centralized log management, provide further depth. Wireless monitoring reveals coverage gaps, access point performance, and rogue device activity, which are particularly relevant in environments heavily dependent on Wi-Fi. Aggregated logs and event management consolidate syslog and SNMP trap data, enabling correlation across multiple sources, which improves root cause identification and accelerates incident resolution.
Designing Dashboards That Convey Context
The efficacy of monitoring tools is amplified by the dashboards that present their data. Dashboards should be conceptualized not as repositories of metrics but as narrative instruments that articulate operational reality. Each layer of a dashboard corresponds to a domain of interest, allowing administrators to interpret complex interactions at a glance.
The user experience layer monitors application responsiveness and transaction completion, capturing the end-user perspective. The network layer provides visibility into real-time node status, interface utilization, flow analysis, and dependency mapping, offering a clear picture of the structural and operational state. Application layers focus on metrics such as CPU and memory usage, service uptime, and database query performance, complemented by filtered log events relevant to critical services.
Configuration awareness layers document changes, policy compliance violations, and automated rollback triggers, connecting operational anomalies with underlying modifications. Log intelligence layers consolidate syslog and event data, offering historical correlation and predictive insight. By integrating these layers, dashboards become a lens through which administrators can simultaneously perceive operational trends, identify emerging threats, and prioritize remediation.
Common Pitfalls in Achieving Effective Visibility
Despite sophisticated tools, many organizations struggle to achieve meaningful visibility due to fragmented implementation and insufficient strategic alignment. One prevalent issue is the default or incomplete configuration of monitoring modules. Tools are installed but not tailored to the organization’s environment, resulting in alerts that are either too sensitive or insufficiently informative.
Another common pitfall is the underutilization of traffic analysis capabilities. Without detailed monitoring of flows, bandwidth utilization, and protocol distribution, network administrators are forced to rely on anecdotal complaints, which limits the precision of interventions. Similarly, configuration management systems are often deployed without automated backups or compliance tracking, leaving organizations vulnerable to silent failures and unauthorized changes.
Dashboards, while visually impressive, frequently suffer from information overload or poor contextualization. Administrators are confronted with extensive metrics but lack the correlation necessary to understand their significance. Logs and event data may be captured but remain unexamined, squandering valuable insights that could inform proactive remediation. Collectively, these pitfalls reflect a broader challenge: tools alone cannot provide visibility; they must be integrated within a coherent strategy and actively managed to deliver actionable intelligence.
Case Study: Uncovering Hidden Anomalies
Consider a regional healthcare provider experiencing intermittent latency across its electronic medical records system. Despite having deployed network performance monitors, traffic analyzers, and configuration management modules, staff were unable to identify the root cause of periodic slowdowns. A detailed assessment revealed multiple contributing factors.
Network performance metrics indicated sporadic packet loss on core switches but provided no context for the underlying cause. Traffic analysis revealed that automated backup processes coincided with peak usage periods, creating temporary bandwidth constraints. Configuration management logs exposed untracked firmware updates on critical devices, some of which failed partially. Application monitoring demonstrated spikes in database query latency corresponding to these events.
Addressing these issues required a multi-pronged approach. Configuration backups were scheduled nightly, and compliance checks were automated to prevent unauthorized modifications. Alert thresholds were refined using historical baselines to increase sensitivity without generating excessive false positives. Traffic segmentation prioritized critical applications, ensuring essential services were not impacted by background processes. Dashboards were restructured to present an integrated view of network, application, and configuration status, allowing both operational teams and leadership to understand ongoing conditions.
The results were transformative. Mean time to resolution decreased significantly, recurring incidents were reduced, and management received clarity into system performance through intuitive dashboards. Proactive identification of unauthorized changes further strengthened operational resilience. This scenario illustrates the tangible benefits of integrated monitoring when applied with strategic intent.
The Strategic Value of Visibility
Visibility extends beyond technical oversight; it represents a strategic enabler for leadership. Executives benefit from predictable uptime, data-backed capacity planning, defensible budget allocations, and enhanced credibility with stakeholders. When monitoring is aligned with business objectives, operational risks are mitigated, and strategic decision-making is strengthened.
Proactive visibility supports continuous improvement by highlighting trends and recurring issues, enabling teams to optimize infrastructure, reduce inefficiencies, and allocate resources more effectively. It provides a mechanism for risk management, allowing organizations to anticipate potential disruptions and implement preventive measures. In essence, visibility translates operational data into strategic insight, creating a foundation for both immediate problem resolution and long-term planning.
Financial Implications of Insufficient Monitoring
Organizations often perceive the cost of monitoring tools as a primary barrier to investment. However, the financial consequences of inadequate visibility typically exceed licensing or deployment expenses. Each unplanned outage, repeated intervention by senior engineers, and unresolved performance degradation carries direct operational costs, including lost productivity, delayed services, and management intervention.
Indirectly, insufficient visibility can erode confidence in IT teams, increase staff stress, and obscure the basis for informed decision-making. Reactive cycles consume time that could otherwise support innovation, optimization, or strategic initiatives. In contrast, a comprehensive monitoring framework reduces downtime, accelerates issue resolution, and enhances overall operational efficiency. The investment in visibility tools is recouped through decreased disruption, improved user satisfaction, and optimized resource allocation, making it a fiscally prudent choice as well as a technical necessity.
Advancing Network Intelligence Through Integrated Monitoring
Modern IT environments are intricate ecosystems where performance, availability, and reliability hinge on a multitude of interconnected components. Servers, switches, access points, applications, and cloud-based services interact continuously, creating a lattice of dependencies. Without comprehensive insight into these interactions, administrators operate in a state of perpetual uncertainty, reacting to symptoms rather than addressing root causes. Integrated monitoring offers a solution, providing end-to-end visibility that illuminates the relationships between network performance, application behavior, and configuration changes.
The core principle of integrated monitoring is correlation. Individual metrics provide limited insight, but when data from network devices, traffic analyzers, application monitors, and configuration management systems are examined in unison, patterns emerge that reveal the underlying drivers of performance anomalies. This approach not only reduces time spent troubleshooting but also uncovers systemic inefficiencies that can be optimized to improve overall operational resilience.
Principles of Holistic Network Oversight
True oversight requires more than mere data aggregation. Holistic monitoring is guided by several principles that define how visibility is established and maintained. The first principle is comprehensive coverage. Every device, interface, and application that contributes to business operations should be monitored, ensuring that blind spots do not obscure critical events. This extends to wireless networks, cloud environments, and distributed systems, which often introduce hidden variables affecting latency, throughput, and reliability.
Second, context-aware analysis is essential. Alerts without context are meaningless; administrators must understand the relationships between different layers of the infrastructure to interpret anomalies accurately. For example, a spike in latency may be network-related, but it could also coincide with a specific application process consuming excessive resources. By correlating network and application data, administrators can isolate the precise source of the problem.
Third, visibility must be actionable. Dashboards, alerts, and reports should not merely report conditions but enable administrators to make informed decisions swiftly. Effective visualization translates complex datasets into intuitive, navigable narratives, highlighting dependencies, pinpointing potential failures, and guiding intervention strategies.
Finally, continuous adaptation is required. IT environments are dynamic, with new devices, software updates, and changing user behaviors altering the operational landscape. Regular recalibration of monitoring thresholds, alerting parameters, and performance baselines ensures that the system remains sensitive to meaningful deviations while minimizing false positives.
Core Components of an Integrated Monitoring Ecosystem
A fully integrated monitoring ecosystem consists of multiple complementary modules, each addressing a distinct operational dimension. The network performance monitoring component tracks device health, interface utilization, latency, and availability. Beyond identifying failures, it provides topology mapping, baseline metrics, and alerting capabilities that support proactive maintenance and incident response.
Traffic analysis is a critical adjunct, offering granular insight into bandwidth usage, protocol-level behavior, and anomalous flows. Without such analysis, vague user complaints about slow performance remain unresolved, forcing teams to rely on guesswork. By monitoring patterns of data movement across the network, administrators can identify congestion points, prioritize critical applications, and preempt bottlenecks before they affect operations.
Application monitoring layers add further depth by measuring service uptime, database query performance, memory consumption, and CPU utilization. These metrics allow teams to distinguish between network-induced slowness and application-specific issues, ensuring that remediation is targeted and efficient. Integrating these insights with network data creates a multi-dimensional perspective, facilitating rapid root cause analysis and informed decision-making.
Configuration management systems complete the ecosystem by tracking changes, enforcing compliance, maintaining automated backups, and enabling quick rollback of failed updates. Every configuration modification is documented, providing transparency into who made changes, what was altered, and when. When performance issues arise, configuration logs provide a direct link between operational anomalies and administrative actions, accelerating resolution and reducing uncertainty.
Additional supporting modules, such as wireless analyzers and log aggregation tools, further enrich visibility. Wireless monitoring identifies coverage gaps, access point status, and rogue clients, while log and event management consolidates syslog and SNMP traps, enabling correlation across diverse data sources. Together, these tools provide a comprehensive, layered view of the infrastructure, transforming raw data into actionable intelligence.
Designing Dashboards That Communicate Operational Reality
Dashboards are not merely aesthetic displays; they are interpretive instruments that convert complex data into actionable narratives. A well-designed dashboard organizes information into layers, each representing a distinct aspect of the IT environment.
The user experience layer captures metrics related to transaction completion, latency, and synthetic tests, reflecting the perspective of end users. The network layer displays real-time node status, interface utilization, traffic flow, and dependency mapping, highlighting structural and operational relationships. Application layers track resource utilization, service uptime, database performance, and critical log events, providing visibility into application health.
Configuration awareness layers monitor change history, policy violations, and automated rollback triggers, linking operational anomalies to specific actions. Log intelligence layers aggregate syslog and event data, offering historical correlation and predictive insights. By integrating these layers, dashboards provide a coherent narrative, enabling administrators to identify emerging issues, prioritize interventions, and understand the implications of anomalies across the infrastructure.
Overcoming Challenges in Achieving Visibility
Many organizations fail to realize the full potential of their monitoring tools due to fragmented deployment, incomplete configuration, and a lack of strategic alignment. Default installation settings often limit the effectiveness of monitoring modules, producing alerts that are either too sensitive or insufficiently informative.
Traffic analysis is frequently underutilized, leaving administrators blind to bandwidth-intensive processes and anomalous flows. Configuration management systems may be deployed without automated backups or compliance oversight, exposing organizations to silent failures and unauthorized changes. Dashboards, while visually compelling, often lack contextual clarity, rendering the metrics difficult to interpret. Logs may be collected but remain unexamined, squandering opportunities for proactive insight.
Collectively, these issues reflect a fundamental truth: visibility cannot be achieved through tool acquisition alone. Strategic planning, integration, and ongoing management are essential to convert disparate modules into a cohesive, actionable monitoring ecosystem.
Case Study: Detecting Latency in a Distributed Environment
A multinational financial institution faced sporadic latency in its core transaction processing system. Despite deploying performance monitoring, traffic analysis, and configuration management tools, staff struggled to identify the root cause. Detailed investigation revealed a confluence of factors:
Network monitoring indicated intermittent packet loss on critical switches, while traffic analysis showed that automated batch processes coincided with peak transaction periods, creating bandwidth contention. Configuration management logs revealed untracked firmware updates, some of which had partially failed, and application monitoring indicated spikes in database query latency during the same intervals.
Addressing these issues required coordinated action. Automated configuration backups and compliance verification were instituted, reducing risk from unauthorized changes. Performance thresholds were refined using historical baselines to improve sensitivity while minimizing false positives. Traffic segmentation prioritized mission-critical applications, preventing background processes from impacting essential operations. Dashboards were redesigned to present an integrated view of network, application, and configuration status, providing clarity for both operational teams and leadership.
The results were immediate and measurable. Mean time to resolution decreased, recurring incidents diminished, and leadership gained transparency into system performance. Unauthorized configuration changes were flagged proactively, further enhancing operational resilience. This case illustrates the importance of integrated monitoring in uncovering subtle, multi-layered issues that isolated tools might miss.
Leadership Perspective: Visibility as a Strategic Asset
End-to-end visibility extends beyond technical oversight to become a strategic enabler for leadership. Executives benefit from improved service-level agreement adherence, predictable uptime, defensible budget requests, and increased credibility with stakeholders. By embedding visibility into organizational processes, IT leaders can anticipate potential disruptions, optimize resource allocation, and make informed strategic decisions.
Proactive monitoring fosters continuous improvement by revealing recurring patterns and trends, enabling optimization of both infrastructure and operational processes. It also supports risk management by providing early detection of anomalies that could escalate into critical incidents. From a leadership standpoint, visibility transforms operational data into a strategic lens, facilitating planning, decision-making, and governance across the enterprise.
Financial Implications of Poor Monitoring
Organizations frequently hesitate to invest in monitoring due to perceived software costs. Yet the financial impact of insufficient visibility often dwarfs licensing and deployment expenses. Every unplanned outage, escalated intervention by senior engineers, and unresolved performance degradation incurs direct operational costs, including lost productivity, delayed transactions, and managerial intervention.
Indirect costs are equally significant. Poor visibility undermines confidence in IT operations, increases staff stress, and hinders informed decision-making. Reactive workflows consume time that could be devoted to optimization, innovation, or strategic initiatives. By contrast, a well-integrated monitoring system reduces downtime, accelerates problem resolution, and improves overall operational efficiency. Investments in visibility provide both immediate and long-term returns, ensuring sustainable performance and resilience.
Embedding Visibility into Organizational Practices
Beyond tools and dashboards, visibility must be a core organizational discipline. Teams should adopt a proactive approach, regularly reviewing dashboards, correlating data across layers, and responding to anomalies systematically. Standard operating procedures should incorporate monitoring as a continuous responsibility rather than a reactive task.
Training, documentation, and structured knowledge sharing are crucial for sustaining this culture. Staff must be equipped to interpret complex metrics, understand correlations, and take informed action. Integration with incident management, change control, and capacity planning processes embeds visibility into the operational fabric, ensuring that monitoring is not an isolated activity but a central element of governance and risk mitigation. By fostering a culture where visibility is normative, organizations enhance resilience, efficiency, and agility.
Advanced Strategies for Multi-Site Environments
Distributed enterprises face unique challenges in maintaining visibility. Multi-site networks introduce latency, varying hardware configurations, and geographically dispersed users, all of which complicate monitoring and incident response. In such contexts, integrated monitoring provides the necessary framework to observe dependencies, identify anomalies, and coordinate interventions across sites.
Centralized dashboards, synthesized from local monitoring agents, provide a unified perspective while retaining site-specific granularity. Traffic analysis tools identify congestion points between sites, and configuration management ensures consistency in updates, compliance enforcement, and rollback capability across the entire network. By harmonizing monitoring efforts across sites, administrators can maintain operational continuity, optimize resource allocation, and respond rapidly to emergent issues.
Enhancing IT Resilience Through End-to-End Network Visibility
In an era where digital operations are the backbone of enterprise performance, the need for comprehensive network visibility has never been more acute. Complex infrastructures, distributed environments, and hybrid cloud architectures amplify the potential for latent issues that can disrupt service continuity. For IT leaders, the challenge is not merely detecting failures but anticipating them, understanding their ramifications, and resolving them swiftly. End-to-end network visibility provides the means to achieve this level of operational clarity, transforming scattered metrics into coherent insight and enabling proactive infrastructure management.
A robust visibility strategy does not emerge spontaneously; it requires deliberate design, disciplined implementation, and continuous adaptation. This approach transcends traditional monitoring, which often focuses on isolated devices or applications. Instead, end-to-end visibility encompasses the full operational ecosystem, correlating performance metrics, traffic flows, configuration changes, and application behavior to present a unified perspective.
Principles Guiding End-to-End Monitoring
Effective monitoring adheres to several guiding principles that ensure insights are both meaningful and actionable. First, coverage must be comprehensive. Every device, server, access point, application, and critical interface should be within the purview of monitoring. Partial oversight introduces blind spots, leaving organizations vulnerable to undetected anomalies that can propagate into major incidents.
Second, monitoring must be context-aware. Isolated metrics convey limited information; administrators require correlation across domains to comprehend the full impact of any event. For example, a latency spike may be symptomatic of network congestion, but when combined with application and configuration data, it may reveal an unoptimized database query or a misconfigured firewall rule. Contextual insight enables precise intervention rather than indiscriminate remediation.
Third, dashboards and visualization tools must convey narratives rather than mere statistics. A well-constructed dashboard organizes metrics into layers, each representing a distinct operational perspective. This structure allows administrators to traverse from a high-level overview to granular analysis seamlessly, interpreting complex interdependencies without cognitive overload.
Finally, monitoring requires continuous evolution. Networks are dynamic, with ongoing hardware upgrades, software deployments, and shifts in user behavior. Thresholds, baselines, and alerting mechanisms must be recalibrated regularly to maintain sensitivity, accuracy, and relevance. A static monitoring environment, however comprehensive at inception, will inevitably fail to reflect the evolving operational reality.
Core Elements of a Comprehensive Monitoring Ecosystem
A fully realized monitoring ecosystem integrates multiple components, each providing a distinct layer of insight while collectively forming a cohesive view. At the foundation is the network performance monitoring system. This module continuously tracks device health, latency, interface utilization, and availability, providing baselines that inform proactive maintenance, alerting, and capacity planning. Visual topology maps reveal dependencies and allow administrators to trace the impact of disruptions.
Traffic analysis complements performance monitoring by illuminating the movement of data through the network. Understanding bandwidth utilization, identifying protocol-specific anomalies, and detecting high-volume flows enables administrators to resolve complaints of sluggish performance with precision. Traffic insights also inform prioritization of critical applications, ensuring operational continuity during periods of elevated load.
Application monitoring adds a critical dimension by measuring service uptime, transaction latency, CPU and memory utilization, and database query performance. This visibility distinguishes network-induced performance degradation from application-specific issues, ensuring that remediation efforts are accurately targeted. Integrating application metrics with network and traffic data produces a multidimensional view that enhances root cause analysis and operational decision-making.
Configuration management systems close the loop by providing transparency into the evolution of the infrastructure. Tracking changes, enforcing compliance, and maintaining automated backups ensure that modifications do not introduce latent vulnerabilities. When incidents occur, configuration logs offer clarity on who implemented changes, what was altered, and when, allowing teams to correlate operational anomalies with administrative actions and rapidly implement corrective measures.
Additional modules, including wireless analyzers and log management systems, augment this visibility. Wireless monitoring identifies coverage gaps, rogue devices, and access point health, which is critical in environments where Wi-Fi is integral. Centralized log aggregation and event correlation provide insight into historical trends and emerging anomalies, supporting both reactive troubleshooting and predictive planning.
Designing Dashboards for Narrative Clarity
Dashboards serve as the interface between complex data and operational insight. A well-designed dashboard should transform multifaceted metrics into a coherent narrative that highlights interdependencies and priorities. Layered dashboards, organized by functional domain, enable administrators to navigate from broad overview to granular detail efficiently.
The user experience layer captures latency, transaction completion, and synthetic test results, reflecting end-user interactions with systems. The network layer displays real-time node status, interface utilization, traffic flow, and topology, revealing structural dependencies and potential bottlenecks. Application layers track service uptime, resource utilization, database performance, and relevant log events, providing a detailed view of application health.
Configuration awareness layers monitor change history, policy compliance, and automated rollback triggers, linking operational anomalies to specific administrative actions. Log intelligence layers consolidate syslog and event data, offering historical context, trend analysis, and predictive insight. By integrating these layers, dashboards evolve from passive displays into actionable intelligence platforms, enabling administrators to identify, interpret, and address complex issues effectively.
Common Barriers to Effective Visibility
Despite the availability of sophisticated monitoring tools, many organizations struggle to achieve meaningful visibility due to fragmented deployment, misconfiguration, and a lack of strategic alignment. Tools are often installed with default settings, generating alerts that are either excessively sensitive or insufficiently informative. Traffic analysis modules may be underutilized, leaving administrators blind to critical bandwidth utilization and protocol anomalies.
Configuration management systems are frequently deployed without automated backups or compliance enforcement, exposing networks to undetected errors and unauthorized modifications. Dashboards may be visually impressive yet fail to provide interpretive context, reducing their utility. Logs and event data may accumulate without analysis, forfeiting potential intelligence. Collectively, these shortcomings highlight a critical truth: technology alone cannot deliver visibility; it must be coupled with thoughtful strategy, integration, and continuous management.
Case Study: Resolving Intermittent Application Latency
A regional retail enterprise faced sporadic latency in its point-of-sale system. Despite deploying performance monitors, traffic analyzers, and configuration management tools, operational staff were unable to identify the source of the disruption. Detailed investigation revealed multiple factors contributing to the issue.
Network monitoring revealed intermittent packet loss on core switches, while traffic analysis indicated that automated backup processes coincided with peak transaction periods, consuming critical bandwidth. Configuration management logs documented untracked firmware updates, some of which had partially failed, and application monitoring identified recurring spikes in database query latency during these intervals.
Addressing these issues required a coordinated approach. Nightly automated configuration backups and compliance verification were implemented to prevent unauthorized changes from impacting operations. Alert thresholds were refined using historical baselines to reduce false positives while enhancing sensitivity to meaningful deviations. Traffic was segmented to prioritize mission-critical applications, ensuring essential services were unaffected by background processes. Dashboards were redesigned to integrate network, application, and configuration data, providing a unified view for operational teams and leadership.
The results were immediate and measurable: mean time to resolution decreased, recurring incidents were minimized, and leadership gained transparent insight into system performance. Unauthorized changes were proactively flagged, further enhancing resilience. This scenario underscores the importance of integrated monitoring in detecting subtle, multi-layered issues that isolated tools might overlook.
Strategic Implications for IT Leadership
Visibility extends beyond technical oversight to become a strategic asset for organizational leadership. Executives benefit from predictable uptime, adherence to service-level agreements, defensible budgeting, and improved credibility with stakeholders. By embedding visibility into operational practices, IT leaders can anticipate potential disruptions, allocate resources effectively, and make informed decisions about infrastructure investment and risk management.
Proactive monitoring also supports continuous improvement. By analyzing recurring patterns, trends, and anomalies, administrators can optimize infrastructure, refine operational processes, and reduce inefficiencies. Predictive intelligence derived from historical data enables preventive actions, minimizing the risk of service disruption. Ultimately, visibility transforms operational data into strategic insight, supporting both tactical interventions and long-term planning.
Managing Multi-Site and Hybrid Environments
Distributed enterprises face additional challenges in achieving visibility. Multi-site networks introduce latency, heterogeneous hardware, and geographically dispersed user populations, complicating monitoring and incident response. Integrated monitoring provides the framework necessary to observe dependencies, detect anomalies, and coordinate interventions across sites.
Centralized dashboards, synthesized from local monitoring agents, provide a unified perspective while retaining site-specific granularity. Traffic analysis identifies bottlenecks and inter-site congestion, while configuration management enforces consistency, compliance, and rollback capability across all locations. Harmonizing monitoring efforts across sites ensures operational continuity, optimized resource allocation, and rapid response to emergent issues.
Achieving Operational Mastery Through Comprehensive Network Visibility
In modern enterprise IT environments, complexity is the norm rather than the exception. Networks span multiple sites, incorporate hybrid cloud components, and support an array of mission-critical applications. Within this intricate architecture, latent issues can emerge from unexpected corners, creating performance degradation or outages that ripple through the organization. Achieving operational mastery in such conditions requires comprehensive visibility, a systematic approach that captures, correlates, and interprets data across network, application, and configuration layers.
End-to-end visibility is not a convenience; it is a strategic imperative. It allows IT teams to transition from reactive problem-solving to proactive management, where anomalies are detected before they escalate, and infrastructure behavior is understood within its broader operational context. The foundation of this capability lies in integrating network performance monitoring, traffic analysis, application oversight, and configuration management into a cohesive ecosystem that transforms raw metrics into actionable insight.
Foundations of Holistic IT Monitoring
A robust monitoring framework rests upon several key principles. First, coverage must be comprehensive. Every device, interface, access point, and application integral to business operations should be monitored. Omissions create blind spots that can obscure systemic issues and delay problem resolution. This principle extends to wireless networks, cloud services, and distributed environments, where performance and latency challenges often originate outside traditional network boundaries.
Second, monitoring must be context-aware. Metrics in isolation provide limited understanding; correlation across multiple layers is necessary to interpret anomalies accurately. A latency spike on a core switch, for example, may result from a congested network segment, a misconfigured firewall, or a high-volume database query. Contextual analysis allows administrators to identify the true source of disruption and implement targeted remediation.
Third, dashboards and visualization tools must transform data into narratives. Effective dashboards organize information by operational domain, enabling a clear view of interdependencies and trends. Administrators can navigate from high-level overviews to granular details, identifying emerging issues and understanding their implications across the infrastructure.
Finally, monitoring must evolve continually. IT environments are dynamic, with hardware upgrades, software updates, and fluctuating workloads altering operational baselines. Thresholds, alerts, and performance metrics must be recalibrated to maintain relevance and sensitivity, ensuring that visibility remains meaningful over time.
Components of a Fully Integrated Monitoring Ecosystem
A comprehensive monitoring ecosystem integrates multiple complementary components, each providing a distinct perspective while contributing to a unified view of operational health. At its core, network performance monitoring continuously tracks device availability, interface utilization, latency, and throughput. Establishing historical baselines, topology maps, and custom alerts allows administrators to detect anomalies proactively and prioritize maintenance effectively.
Traffic analysis modules add granularity by capturing bandwidth utilization, protocol distribution, and anomalous flow behavior. Understanding the movement of data across the network enables administrators to pinpoint congestion points, optimize resource allocation, and resolve complaints of sluggish performance with precision. Traffic visibility also informs application prioritization, ensuring that mission-critical processes are not impeded by background activity.
Application monitoring provides a further layer of insight by tracking service uptime, transaction performance, CPU and memory utilization, and database query efficiency. This enables administrators to distinguish between network-induced performance degradation and application-specific issues, ensuring that troubleshooting efforts are both accurate and efficient. Correlating these metrics with network and traffic data produces a multidimensional view of operational behavior, supporting faster root cause analysis.
Configuration management systems complete the ecosystem by tracking changes, enforcing policy compliance, maintaining automated backups, and enabling rapid rollback of failed updates. When incidents occur, detailed configuration logs clarify who implemented changes, what was altered, and when, linking operational anomalies directly to administrative actions. This transparency reduces downtime and supports rapid recovery from unintended modifications.
Additional supporting modules, such as wireless analyzers and log aggregation tools, expand visibility further. Wireless monitoring identifies coverage gaps, rogue clients, and access point health, while centralized log and event management consolidates syslog and SNMP traps, providing correlation across multiple sources. Together, these elements form a holistic infrastructure intelligence framework capable of delivering actionable insight across the enterprise.
Building Dashboards That Provide Contextual Insight
Dashboards are critical in translating data into operational clarity. A well-constructed dashboard organizes metrics into layers representing different operational domains. This layered approach allows administrators to traverse from broad, high-level insights to detailed, domain-specific information without losing perspective.
The user experience layer captures metrics such as latency, transaction completion rates, and synthetic tests, reflecting end-user interaction with systems. The network layer provides real-time node status, interface utilization, traffic analysis, and topology mapping, illuminating structural dependencies and potential points of failure. Application layers track resource utilization, service uptime, database performance, and relevant log events, offering detailed insight into application health.
Configuration awareness layers monitor change history, policy compliance, and automated rollback triggers, linking operational anomalies to administrative activity. Log intelligence layers consolidate event data, providing historical context, trend analysis, and predictive insight. By integrating these layers, dashboards evolve from static metrics repositories into dynamic intelligence tools, enabling administrators to interpret operational conditions and respond effectively.
Case Study: Optimizing Performance in a Multi-Site Enterprise
A multinational logistics company faced intermittent service degradation affecting its warehouse management system. Despite deploying performance monitoring, traffic analysis, and configuration management modules, operational teams struggled to identify the root cause. Detailed investigation revealed a combination of network congestion, misaligned configuration changes, and periodic high-volume application processes.
Network monitoring identified packet loss and latency spikes at regional data center switches. Traffic analysis revealed that automated backup operations coincided with peak business hours, generating bandwidth contention. Configuration management logs documented unauthorized firmware updates, some of which failed partially, while application monitoring captured recurring spikes in database query latency during these periods.
Resolving these issues required a coordinated strategy. Automated nightly backups and compliance verification reduced risk from unauthorized changes. Alert thresholds were refined using historical baselines to improve sensitivity while minimizing false positives. Traffic prioritization ensured that mission-critical applications were unaffected by background operations. Dashboards were redesigned to integrate network, application, and configuration metrics, providing both operational teams and leadership with a unified view.
The results were significant: mean time to resolution decreased, recurring incidents diminished, and management gained transparent insight into system performance. Unauthorized changes were flagged proactively, enhancing resilience. This case highlights the value of integrated monitoring in uncovering complex, multi-layered operational issues that might otherwise remain hidden.
Leadership Perspective: Visibility as a Strategic Differentiator
End-to-end visibility extends beyond technical oversight, becoming a strategic enabler for leadership. Executives gain predictable uptime, improved SLA adherence, defensible budget justification, and enhanced credibility with stakeholders. Embedding visibility into operational processes enables IT leaders to anticipate disruptions, allocate resources effectively, and make informed strategic decisions.
Proactive visibility also fosters continuous improvement by identifying recurring patterns, enabling infrastructure optimization, and refining operational workflows. Predictive insights derived from historical data empower preventive actions, reducing the risk of service disruptions. Visibility, therefore, transforms operational intelligence into strategic foresight, enabling both tactical interventions and long-term planning.
Financial Considerations of Inadequate Monitoring
Organizations frequently hesitate to invest in monitoring due to perceived costs, yet the financial impact of inadequate visibility can far exceed licensing and deployment expenses. Each unplanned outage, escalated support intervention, and unresolved performance issue carries direct operational costs, including lost productivity, delayed transactions, and managerial intervention.
Indirect costs are equally significant. Poor visibility erodes confidence in IT operations, increases staff stress, and impedes informed decision-making. Reactive workflows consume time that could otherwise be applied to optimization, innovation, or strategic initiatives. Conversely, a comprehensive monitoring ecosystem reduces downtime, accelerates problem resolution, and enhances overall operational efficiency. Investments in visibility deliver tangible returns, ensuring continuity, reliability, and resilience.
Conclusion
Achieving comprehensive network visibility is a cornerstone of modern IT operations, transforming fragmented data into actionable insight and operational intelligence. By integrating network performance monitoring, traffic analysis, application oversight, and configuration management, organizations gain the ability to detect anomalies, correlate root causes, and respond proactively before issues escalate. Well-designed dashboards and visualization tools translate complex metrics into coherent narratives, providing clarity across infrastructure layers while supporting both technical teams and leadership in decision-making.
Beyond technology, visibility is a strategic discipline, embedded in organizational culture through continuous monitoring, predictive intelligence, and process integration. It enhances resilience, reduces downtime, optimizes resource allocation, and strengthens operational governance. The investment in comprehensive visibility delivers measurable returns in efficiency, reliability, and business continuity. Ultimately, end-to-end visibility empowers organizations to operate with confidence, anticipate challenges, and maintain high-performance, agile IT environments that align with strategic objectives and evolving business demands.


