Certification: Certified Implementation Specialist - Event Mangement
Certification Full Name: Certified Implementation Specialist - Event Mangement
Certification Provider: ServiceNow
Exam Code: CIS-EM
Exam Name: Certified Implementation Specialist - Event Mangement
Product Screenshots
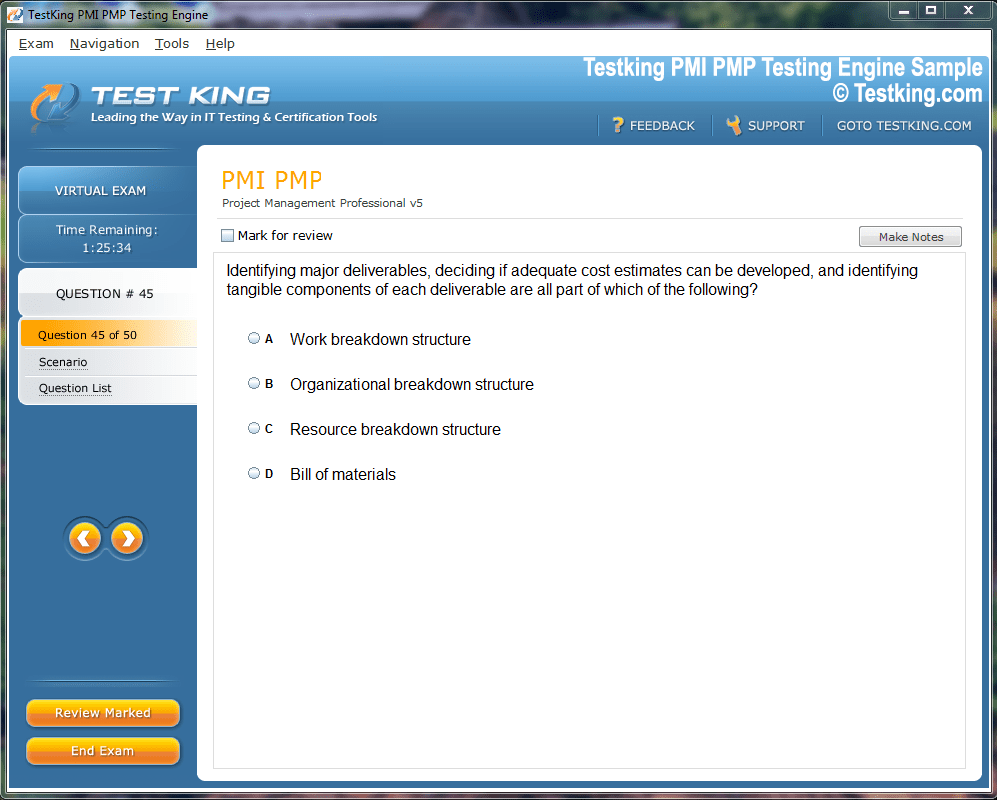
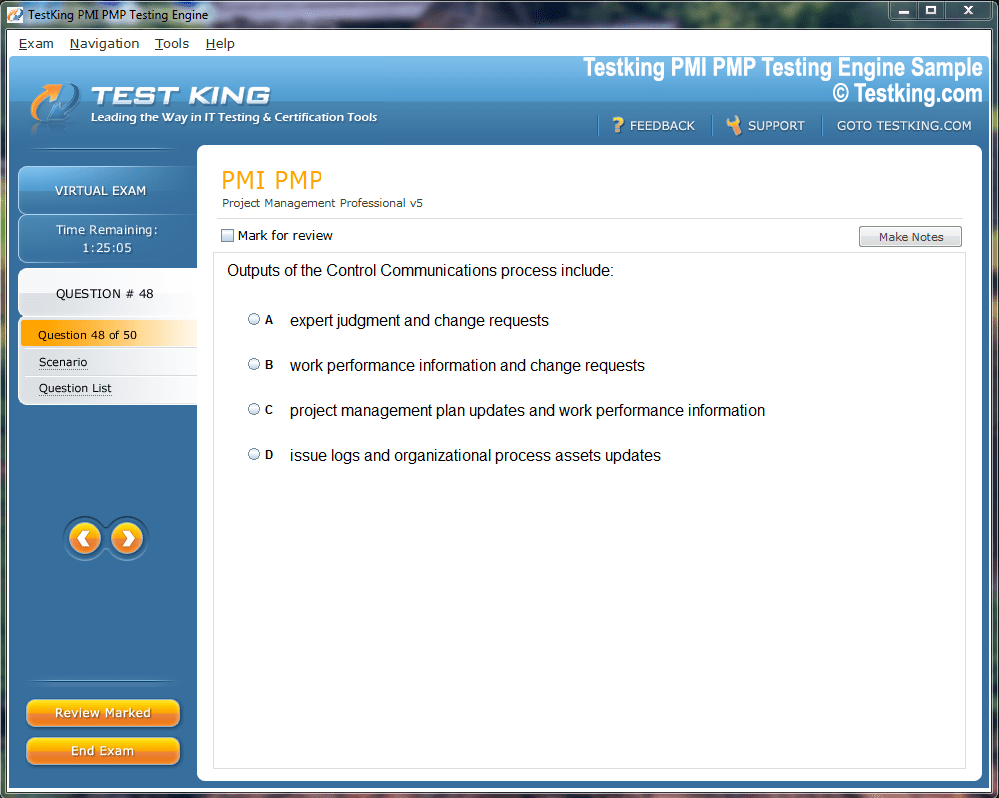
nop-1e =1
Mastering ServiceNow with Certified Implementation Specialist - Event Management Certification
In the contemporary landscape of digital operations, organizations depend heavily on cohesive platforms that ensure smooth management of complex IT ecosystems. The ServiceNow Certified Implementation Specialist – Event Management certification stands as a testament to expertise in deploying and maintaining one of the most dynamic components of the ServiceNow ecosystem. This certification is more than an acknowledgment of skill; it signifies a practitioner’s competence in orchestrating event-driven architectures, managing alerts, optimizing workflows, and maintaining stability across vast IT environments.
The role of event management within ServiceNow is not merely technical but strategic. It allows enterprises to foresee operational anomalies before they cascade into disruptions, ensuring service continuity and operational excellence. The ServiceNow Event Management application integrates seamlessly into the broader ServiceNow platform, bridging multiple IT Operations Management (ITOM) functions into a unified framework that supports detection, analysis, and resolution. For professionals seeking to validate their mastery over this intricate domain, the Certified Implementation Specialist – Event Management credential offers both recognition and opportunity.
Purpose of the Exam
The core purpose of this certification lies in evaluating an individual’s capacity to apply practical knowledge to real-world configurations, administrative setups, and the holistic management of the Event Management application. Through this exam, candidates demonstrate proficiency in configuring events, interpreting complex data flows, integrating diverse event sources, and aligning system behaviors with operational requirements.
Professionals who achieve this certification are expected to exhibit not only technical acuity but also a deep conceptual understanding of how event management contributes to the broader ITOM strategy. Their expertise aids in transforming unstructured event noise into actionable intelligence, thereby enabling proactive issue resolution. The certification ensures that the candidate is well-equipped to implement event workflows that sustain resilience, automation, and cross-platform synergy.
Who the Certification Is Designed For
The certification caters to a diverse audience within the ServiceNow ecosystem. It is available to ServiceNow customers who aim to expand their internal capabilities, partners seeking to enhance client solutions, and employees who aspire to solidify their implementation expertise. Additionally, it serves those who are keen on advancing as Event Management Implementers or Administrators.
Each participant, regardless of their professional background, gains a profound understanding of how to interpret operational events and convert them into meaningful insights. The knowledge attained through this certification empowers professionals to deploy event management frameworks that reduce downtime, enhance visibility, and foster intelligent monitoring systems.
The scope of this audience includes system administrators, implementation consultants, project managers, technical architects, and operations analysts. Collectively, they represent the broad spectrum of professionals essential for an effective event-driven management approach within the ServiceNow environment.
Overview of the Examination Structure
The ServiceNow Certified Implementation Specialist – Event Management exam is meticulously designed to assess both conceptual and practical understanding. The structure embodies a comprehensive approach that tests analytical thinking, configuration precision, and process comprehension.
The examination comprises 30 multiple-choice questions, designed to be completed within a 60-minute duration. The evaluation framework is pass/fail, ensuring that the focus remains on competency rather than percentile ranking. The exam is structured to validate the ability to navigate various aspects of Event Management, including configuration, alert handling, event correlation, and system architecture.
Participants are expected to possess a foundational grasp of ServiceNow functionality, along with practical familiarity with IT Operations Management concepts. The exam is priced at USD $450, signifying the value placed on acquiring an authoritative credential in this specialized discipline.
The emphasis is not solely on theoretical recollection but also on the practical application of knowledge in dynamic IT environments. Candidates must understand how to apply configuration principles, optimize alert mechanisms, and integrate diverse monitoring tools to achieve cohesive event visualization and control.
Understanding the Core Domains of the Exam
The examination syllabus is distributed across multiple domains, each focusing on a critical segment of Event Management operations. The proportion of weight assigned to each topic reflects its significance within real-world implementation practices.
The first domain, Event Management Overview, introduces the foundational principles of the IT Operations Management solution within ServiceNow. It covers the identification of customer challenges, key features, and the graphical interfaces such as the operator workspace, alert intelligence, and dependency maps. A deep comprehension of the Common Service Data Model, encompassing business, application, and technical services, is also essential. This domain establishes the groundwork upon which more complex configurations are constructed.
Architecture and Discovery form the second domain, emphasizing the significance of the MID Server architecture, the interrelation between the Configuration Management Database and Event Management, and the processes associated with discovery and monitoring. Candidates are required to grasp how these architectural elements coalesce to deliver a seamless event detection framework that aligns with the organization’s infrastructure.
The most heavily weighted section, Event Configuration and Use, delves into the intricacies of setting up events, defining event rules, and managing thresholds. It explores how events are processed, filtered, and visualized through the operator workspace. This section also incorporates scripting practices, highlighting the integration of technologies like Regex, JavaScript, and PowerShell in the configuration process. The ability to tailor connectors, whether preconfigured or custom, becomes a crucial skill set in this area.
Alerts and Tasks encompass another major portion of the exam, covering the complete alert management cycle—from definition and creation to grouping and resolution. Candidates must comprehend the alert lifecycle, understand how alerts interact with Configuration Items, and apply best practices for prioritization and correlation. The concept of alert intelligence, impact profiles, and Service Level Agreement interactions are vital elements that showcase the practitioner’s ability to manage complex incident dependencies effectively.
Lastly, the Event Sources domain focuses on identifying and configuring sources of event data. It explains push and pull mechanisms, inbound actions, and the nuances of establishing monitoring connectors. Mastery in this domain enables professionals to orchestrate a continuous stream of event inputs that feed into the system’s analytical core.
The Role of Event Management in IT Operations
Event Management is an integral component of ServiceNow’s IT Operations Management suite. Its fundamental purpose is to detect events across systems and translate them into actionable alerts that can be triaged and resolved efficiently. By centralizing event data, the platform minimizes noise and ensures that operational teams focus on incidents of genuine importance.
In practical terms, the Event Management application acts as a sentinel across the enterprise infrastructure, continuously monitoring for deviations or anomalies that may indicate potential issues. This capacity for real-time insight reduces the mean time to detect and resolve issues, preserving service stability and enhancing the end-user experience.
Organizations leveraging Event Management achieve greater operational transparency. It enables IT teams to identify patterns, recognize potential bottlenecks, and refine performance metrics. Through intelligent correlation and automated response mechanisms, the platform reduces manual intervention, facilitating a smoother operational cadence.
The alignment of Event Management with the Common Service Data Model further amplifies its effectiveness. By linking alerts and events to defined business and technical services, ServiceNow ensures that operational insights are contextualized within the organizational hierarchy. This contextual awareness empowers decision-makers to prioritize actions based on business impact rather than isolated technical triggers.
Architectural Underpinnings of the Event Management Framework
The architecture of ServiceNow Event Management exemplifies a robust, layered design that integrates various discovery and monitoring mechanisms. The MID Server, a pivotal element in this architecture, acts as a conduit for communication between the ServiceNow instance and external monitoring tools. Its validation and configuration are essential to maintaining a secure and consistent data exchange.
The integration with the Configuration Management Database enhances visibility into the relationships among Configuration Items and their dependencies. This synergy allows events to be accurately mapped to affected services, ensuring precise impact analysis. The monitoring process itself follows a structured flow, where raw event data is ingested, processed, normalized, and converted into meaningful alerts.
Event Management’s architectural composition also supports extensibility through scripting and connectors. The platform allows the customization of event processing logic, enabling administrators to adapt to diverse monitoring environments. Whether through regex patterns, JavaScript snippets, or PowerShell integrations, the system accommodates flexible solutions that align with unique infrastructure requirements.
Configuring and Utilizing Events Effectively
Configuration within Event Management is both a technical and analytical endeavor. The process involves establishing event rules, filters, and thresholds that define how data is interpreted and displayed. Event processing jobs ensure that raw data transitions seamlessly into structured insights.
The operator workspace serves as the central interface for monitoring these events, offering visualizations that assist in identifying trends and anomalies. Within this workspace, professionals interact with event tables, manage message keys, and map fields to ensure consistency in event interpretation. Configuration Item binding ensures that alerts and events are contextually linked to the appropriate infrastructure components, facilitating faster root-cause analysis.
Connectors serve as the bridge between ServiceNow and external monitoring systems. They can be preconfigured or custom-built, depending on organizational needs. These connectors enable the ingestion of diverse event types, ensuring that the Event Management application remains adaptable across varying IT ecosystems.
Scripting is another dimension of configuration. Through scripting, administrators can manipulate event logic, define parsing rules, and automate repetitive tasks. The combined use of scripting languages allows for fine-tuned control, ensuring that the event management framework remains responsive and efficient under varying conditions.
Alert Handling and Task Management Principles
Alert management represents the evolution of event processing into actionable operations. Alerts are defined by specific attributes and governed by scheduled jobs that dictate how they evolve through the system. The alert process flow encapsulates multiple stages, from creation and classification to prioritization and resolution.
The configuration of alert management rules ensures that alerts are automatically correlated with their corresponding Configuration Items. This correlation is vital in maintaining operational coherence and enabling targeted responses. Priority scores and groups further refine the process, ensuring that resources are allocated based on urgency and impact.
The concept of alert grouping simplifies management by aggregating related alerts, reducing redundancy, and streamlining resolution workflows. Correlation rules play a critical role in this process, distinguishing between isolated incidents and those that share a common origin.
Alert intelligence introduces a predictive dimension, leveraging machine learning and data analytics to anticipate potential escalations. The alert impact profile complements this by delineating the scope of an issue, mapping out the affected clusters, and determining its influence on Service Level Agreements. This interconnected understanding forms the foundation for proactive incident response and service optimization.
The Significance of Event Sources
Event sources are the lifeblood of the Event Management application. They encompass the systems, applications, and services that generate operational data. Understanding these sources is crucial to constructing a reliable and efficient monitoring ecosystem.
Push and pull methodologies define the mechanisms through which data is transmitted. In push mode, external systems send event information to ServiceNow, while pull mode involves ServiceNow retrieving data from designated endpoints. Both methods are essential for achieving a comprehensive event ingestion strategy.
Inbound actions offer further control, allowing administrators to automate the processing of incoming data and trigger predefined workflows. The configuration of monitoring connectors ensures that event flow remains consistent and aligned with the overall monitoring objectives.
By mastering the principles governing event sources, professionals establish a resilient event management environment that supports continuous monitoring and agile response capabilities.
Deep Exploration of Event Management Architecture and Discovery in ServiceNow
The ServiceNow Event Management architecture serves as the backbone of the platform’s operational intelligence framework. It unifies disparate monitoring systems, integrates event data from multiple sources, and transforms these inputs into actionable insights that fuel decision-making and service stability. This architectural design is not static; it evolves alongside enterprise requirements and technological advancements, ensuring adaptability in an ever-changing digital environment.
At its essence, architecture in Event Management represents the orchestrated connection between system components, databases, integration points, and processing mechanisms. Each element plays a unique role in how events are captured, normalized, correlated, and displayed. Understanding this architectural model is crucial for professionals aiming to excel as Certified Implementation Specialists in Event Management, as it forms the foundation of every configuration, implementation, and optimization task.
ServiceNow’s Event Management architecture is engineered for precision and scalability. It leverages a layered model where event ingestion, processing, and alert creation are distinctly compartmentalized but deeply interconnected. The elegance of this structure lies in its capacity to handle vast volumes of event data while maintaining clarity and performance across complex infrastructures.
Core Architectural Components
At the heart of the Event Management system lies the interaction between the Configuration Management Database (CMDB), the MID Server, and external monitoring tools. Together, they constitute the fundamental triad of event discovery, analysis, and resolution.
The Configuration Management Database operates as the central repository for all Configuration Items (CIs) within an organization. It stores relationships, attributes, and dependencies, allowing Event Management to map every event or alert to a specific service or infrastructure element. This mapping ensures that every operational anomaly is contextualized, thus enabling accurate impact assessment.
The MID Server serves as a secure intermediary between the ServiceNow instance and external systems. It collects data, facilitates integrations, and ensures secure communication between cloud-based and on-premises environments. Its validation and maintenance are vital for the seamless transfer of monitoring information, discovery data, and event inputs.
External monitoring tools—such as infrastructure performance systems, log analyzers, and application monitors—act as event sources that feed data into the Event Management application. These tools can vary in complexity and format, yet ServiceNow’s adaptable connectors ensure that all event inputs are harmonized within the platform’s ecosystem.
The Functionality of the MID Server in Discovery
The MID Server is indispensable in establishing connectivity between ServiceNow and enterprise infrastructures. It acts as the operational bridge that retrieves information from remote systems, ensuring that data integrity and security remain intact. In the discovery process, the MID Server performs the critical role of identifying devices, applications, and services across networks.
When an organization deploys a MID Server, it must ensure proper configuration to align with security protocols and network accessibility. The discovery mechanism uses the MID Server to execute probes and sensors—automated scripts designed to detect system configurations, dependencies, and performance metrics. This information is then transmitted back to the ServiceNow instance, where it populates and updates the CMDB.
The synergy between the MID Server and Event Management architecture allows organizations to maintain a living model of their IT environment. As new systems emerge or configurations change, discovery updates ensure that the CMDB remains accurate and reflective of the current infrastructure. This dynamic synchronization is pivotal in achieving reliable event correlation and precise root-cause identification.
The Role of Discovery in Event Management
Discovery within ServiceNow’s Event Management framework transcends basic inventory tracking. It establishes the contextual backbone that supports event correlation and alert generation. Without accurate discovery data, event processing can become fragmented, leading to incomplete or misleading insights.
Discovery operates through automated scans that identify network components, software, and services. The process not only detects Configuration Items but also establishes the relationships between them. These interconnections are crucial because Event Management relies heavily on understanding how an alert in one part of the system may cascade into another.
For instance, if a network switch experiences latency, discovery data ensures that Event Management recognizes which servers or applications depend on that switch. Consequently, when an alert is triggered, the platform can calculate the ripple effect across related Configuration Items, allowing administrators to address the root cause rather than isolated symptoms.
Accurate discovery contributes to operational harmony. It minimizes event noise, refines alert correlation, and strengthens visibility across the enterprise ecosystem. This interconnected understanding empowers professionals to deploy proactive event responses and ensure the stability of business-critical services.
Event Management Architecture and Its Integration with CMDB
One of the defining features of ServiceNow’s Event Management design is its deep integration with the Configuration Management Database. This integration transforms raw event data into meaningful, service-oriented intelligence. Each event captured within the platform is associated with a Configuration Item, ensuring that all occurrences are tied to tangible elements of the IT landscape.
The CMDB acts as both a reference and a filter. When an event arrives, the system identifies its source, cross-references it with CMDB records, and determines which service or device is implicated. This association allows the system to aggregate related alerts and create a unified picture of the incident’s impact.
Moreover, this relationship enables ServiceNow to support automated impact analysis. By examining the dependency maps stored within the CMDB, the platform can identify which business services may experience degradation due to specific infrastructure anomalies. This capability not only enhances operational transparency but also accelerates response times and reduces downtime.
The Event Management and CMDB integration exemplifies a symbiotic relationship—discovery populates the CMDB, which in turn strengthens event correlation, while Event Management continuously refines the accuracy of the data stored. Together, they form the analytical engine that drives efficient monitoring and resolution workflows.
The Monitoring Process and Data Flow
The monitoring process in Event Management follows a precise data flow that ensures efficient event handling from ingestion to alert creation. Each stage of this flow contributes to filtering, normalizing, and categorizing event information.
The process begins with event ingestion, where data from multiple sources is received through configured connectors. Once ingested, event processing mechanisms interpret the incoming data, identifying key attributes such as event type, severity, and source. The system applies event rules, which determine how these inputs are managed—whether they should generate alerts, update existing records, or be filtered out as redundant noise.
Subsequently, correlation and deduplication come into play. These processes ensure that repetitive or similar events are grouped into single, manageable alerts. By doing so, Event Management prevents the platform from being overwhelmed by redundant information. The refined alerts are then stored and displayed through graphical interfaces like the operator workspace or dependency maps, giving administrators a clear visual representation of ongoing system health.
Each of these stages depends on the architectural cohesion of ServiceNow’s Event Management framework. The monitoring process transforms vast volumes of data into structured insights that guide intelligent decision-making.
Validating the MID Server and Its Operational Continuity
Ensuring the reliability of the MID Server is crucial for the sustained performance of Event Management. Validation involves confirming that the server is correctly installed, configured, and authorized to communicate with the ServiceNow instance.
Administrators must regularly verify parameters such as connection status, credentials, network access, and version compatibility. A malfunctioning or misconfigured MID Server can interrupt event ingestion, discovery updates, and connector operations, leading to data inconsistencies.
ServiceNow provides diagnostic utilities that allow administrators to monitor the health of the MID Server. Logs and metrics provide insights into communication attempts, errors, and performance trends. Continuous validation and maintenance ensure that the flow of data between on-premises systems and the ServiceNow platform remains seamless and secure.
Moreover, establishing redundancy through multiple MID Servers enhances reliability. In large organizations, distributed MID Servers can be strategically deployed across different network zones to balance load and ensure availability even if one server experiences downtime. This architectural resilience supports uninterrupted discovery and event monitoring operations.
Achieving Operational Cohesion through Architecture and Discovery
The integration of architecture and discovery results in an intelligent operational ecosystem. When implemented effectively, these components form a unified system that continuously adapts to infrastructure changes while maintaining monitoring precision.
Operational cohesion emerges when each architectural element—MID Server, CMDB, connectors, and event processing engine—functions harmoniously. Discovery updates enrich the CMDB, which in turn refines event correlation. The MID Server ensures uninterrupted communication, while connectors keep the flow of event data consistent.
This synergy eliminates fragmentation, allowing organizations to maintain holistic visibility across networks, applications, and services. It also enables predictive operations, where data-driven insights guide preventive maintenance and optimization strategies.
In practice, this means that issues are detected earlier, responses are faster, and service disruptions are minimized. The architectural and discovery framework thus becomes the foundation upon which proactive IT Operations Management thrives.
Event Management in Multi-Source Environments
Modern enterprises rarely rely on a single monitoring system. Instead, they deploy a constellation of tools—network monitors, cloud analytics platforms, performance dashboards, and security systems. ServiceNow’s Event Management architecture accommodates this complexity by integrating diverse event sources through a flexible connector framework.
Connectors are configured to receive data in multiple formats—Syslog, SNMP, HTTP, or custom APIs. This versatility ensures that, regardless of the origin, all event information converges into a unified platform. Once within ServiceNow, event processing rules standardize the data, aligning it with the Common Service Data Model.
This multi-source adaptability reduces silos and fosters interoperability between disparate systems. It also empowers IT teams to manage the entire operational spectrum from a single interface, consolidating insights and enhancing situational awareness.
Architectural Best Practices and Optimization Strategies
To harness the full potential of Event Management architecture, professionals must adhere to certain best practices. These practices revolve around stability, scalability, and maintainability.
Maintaining an accurate CMDB remains the foremost requirement. Without precise Configuration Item data, event correlation becomes unreliable. Regular discovery scans and data audits ensure that the CMDB reflects current infrastructure states.
Another essential practice is the deployment of multiple MID Servers for redundancy and load distribution. This approach safeguards against bottlenecks and ensures continuity even during network or system interruptions.
Administrators should also implement standardized naming conventions, structured event rules, and clear threshold definitions. These ensure that events are processed logically, reducing noise and improving clarity.
Periodic review of connector configurations is equally vital. As systems evolve, new event sources may emerge while others become obsolete. Regular optimization ensures that only relevant data flows into the Event Management system, maintaining operational efficiency.
Mastering Event Configuration and Utilization in ServiceNow Event Management
Event configuration in ServiceNow Event Management is the fulcrum upon which effective monitoring, automation, and incident response rest. It transforms the abstract flow of system events into structured intelligence that drives action and resolution. Configuration is not merely a technical endeavor; it represents the articulation of operational logic within the ServiceNow ecosystem. The precision of this configuration determines the accuracy of event detection, the clarity of alerts, and the overall efficiency of IT Operations Management.
In any enterprise environment, events occur incessantly—applications generate performance metrics, servers log operational data, and network devices emit status updates. Without a cohesive framework to interpret these occurrences, organizations risk being overwhelmed by data noise. ServiceNow’s Event Management addresses this challenge through meticulous configuration processes that normalize, filter, correlate, and prioritize events.
The ServiceNow Certified Implementation Specialist – Event Management certification evaluates a professional’s ability to perform these configuration skills effectively. A deep understanding of event processing principles, event rules, filters, thresholds, and the operator workspace is essential. By mastering these components, specialists ensure that the platform delivers precise and actionable insights rather than raw, unrefined data.
Understanding Event Processing
Event processing is the foundation upon which all subsequent actions in ServiceNow Event Management are built. When an event enters the platform—whether through a connector, API, or external monitoring tool—it undergoes a defined sequence of transformation.
The process begins with the ingestion of event data, followed by the parsing and normalization phase. Here, the system interprets raw event attributes and converts them into standardized fields recognized by ServiceNow. This ensures that events from disparate sources are uniformly understood, regardless of origin or format.
Event rules then determine how each event is handled. These rules can filter out redundant data, suppress unnecessary alerts, or trigger the creation of new records. The configuration of event rules requires both strategic foresight and technical precision. It involves defining conditions that specify which events are critical, which should be ignored, and which must trigger automation.
Thresholds further refine event handling. By establishing thresholds, administrators set quantitative limits that define when an event should escalate into an alert. For example, a CPU usage event may only be considered significant if it surpasses a defined percentage over a sustained period. This mechanism prevents transient spikes from generating false alarms, maintaining the integrity of the alert system.
The event processing engine embodies the platform’s intelligence, filtering chaos into coherence. Through continuous tuning and optimization, it ensures that only events of true operational value progress into actionable alerts.
The Operator Workspace and Its Functional Significance
The operator workspace serves as the command center for Event Management activities. It provides administrators and operators with a panoramic view of the enterprise’s operational health, represented through dynamic dashboards, event grids, and visual maps.
Within this workspace, users can monitor ongoing events, review alert statuses, and analyze historical trends. The interface consolidates essential metrics such as event count, alert severity, and affected services. It empowers teams to identify anomalies at a glance and prioritize their responses accordingly.
The operator workspace also enables interaction with event data in real time. Users can acknowledge, assign, or resolve alerts directly from the interface. Dependency maps offer a visual representation of the relationships between Configuration Items, allowing operators to trace the cascade of impacts across the infrastructure.
One of the defining strengths of the operator workspace is its adaptability. It can be customized to display specific event categories, focus on particular services, or emphasize critical alerts. This flexibility allows each organization to tailor the workspace according to its operational priorities and response frameworks.
The Role of Connectors in Event Management
Connectors are the conduits that enable ServiceNow to communicate with external monitoring tools and systems. They play an instrumental role in ensuring that event data flows seamlessly into the platform.
Preconfigured connectors, available for widely used monitoring tools, simplify the integration process. These connectors include predefined mappings and parsing logic, enabling rapid deployment. Examples include connectors for cloud monitoring platforms, infrastructure management tools, and application performance systems.
Custom connectors, on the other hand, provide flexibility for organizations with unique monitoring solutions. Through scripting and configuration, administrators can create connectors that interpret proprietary data formats and integrate them into the ServiceNow ecosystem.
The effectiveness of a connector depends on its configuration accuracy. It must define not only the method of data transfer—whether via REST APIs, SNMP traps, or syslog messages—but also the structure of the data being ingested. By establishing clear mappings and validation parameters, organizations ensure that incoming events are correctly interpreted and processed.
An efficiently configured connector ecosystem transforms ServiceNow into a unified monitoring hub that assimilates diverse data streams into a single, coherent operational perspective.
Scripting in Event Configuration
Scripting introduces a layer of sophistication and adaptability to event configuration. ServiceNow supports multiple scripting languages, including Regex, JavaScript, and PowerShell, each serving distinct purposes within the Event Management framework.
Regular expressions (Regex) are particularly useful for parsing event messages. They allow administrators to extract specific data elements from complex text strings, ensuring precise field mapping. Through Regex, patterns within event data—such as error codes or component identifiers—can be isolated and interpreted automatically.
JavaScript extends the platform’s flexibility, enabling administrators to customize event processing logic. Scripts can be executed at various stages of the event flow, allowing dynamic manipulation of data, conditional rule application, and automation of repetitive tasks. This scripting capability empowers professionals to tailor Event Management behavior to their organization’s unique operational needs.
PowerShell is often employed when integrating with Windows-based environments. It allows administrators to interact with system-level components, retrieve monitoring data, and perform configuration tasks programmatically.
Collectively, these scripting capabilities enable a refined level of control, ensuring that the event processing system remains agile, responsive, and capable of adapting to evolving infrastructures.
Ensuring Efficiency Through Event Correlation and Deduplication
Event correlation and deduplication form the intellectual core of ServiceNow Event Management. They prevent data saturation and enable administrators to identify meaningful patterns amidst large volumes of events.
Correlation identifies relationships between events based on message keys, sources, or contextual attributes. When multiple events pertain to the same issue, correlation logic aggregates them into a single alert. This simplification allows teams to focus on root causes rather than symptom-level noise.
Deduplication ensures that repeated occurrences of the same event do not generate redundant alerts. By recognizing identical patterns within event streams, the system updates existing alerts instead of creating new ones. This not only reduces clutter but also provides a consolidated history of event activity, enhancing analytical accuracy.
The configuration of correlation and deduplication rules requires a nuanced understanding of system behavior. Overly broad rules may merge unrelated events, while excessively narrow ones may fail to capture significant relationships. Achieving equilibrium in this configuration is a hallmark of an experienced implementation specialist.
Leveraging Dependency Maps and Alert Intelligence
Dependency maps visually represent the intricate web of relationships among Configuration Items. They provide operators with an intuitive understanding of how an event in one component can influence others across the service chain.
These maps are not static; they dynamically adjust as discovery processes update the CMDB. When an alert arises, dependency visualization allows teams to trace the potential impact across applications, servers, and network components. This capability enhances situational awareness and expedites decision-making during critical incidents.
Alert intelligence, meanwhile, enhances this process through data-driven analysis. It employs historical trends and predictive modeling to identify potential risks before they escalate. Through continuous learning, alert intelligence evolves, refining correlation logic and minimizing false positives.
Together, dependency maps and alert intelligence represent the culmination of ServiceNow’s analytical capabilities—turning reactive monitoring into proactive governance.
Optimizing Event Thresholds for Performance Stability
Thresholds are the silent guardians of event stability. Properly configured thresholds ensure that alerts are generated only when performance deviations genuinely threaten service quality.
Setting thresholds involves balancing sensitivity and specificity. Too low a threshold may trigger frequent alerts, desensitizing operators, while too high a threshold may cause critical issues to go unnoticed. Administrators must rely on performance baselines derived from historical data to establish appropriate limits.
Adaptive thresholding, an advanced technique, leverages dynamic data patterns to adjust limits automatically. This ensures responsiveness to fluctuating workloads, reducing the need for constant manual recalibration.
Consistent threshold optimization enhances system efficiency, prevents unnecessary escalations, and maintains the equilibrium of monitoring operations.
Advanced Alert Management and Operational Excellence in ServiceNow Event Management
In ServiceNow Event Management, alert management represents the decisive stage where raw event data is refined into actionable insight. Events, after being filtered and correlated, culminate in alerts—concise indicators of anomalies that demand attention. These alerts are not arbitrary notifications; they embody the synthesis of analytical processing, business logic, and operational context. Managing them effectively determines how swiftly and accurately organizations can respond to disruptions, optimize performance, and sustain service continuity.
ServiceNow’s alert management process is designed to ensure that no critical signal goes unnoticed while avoiding the fatigue caused by excessive or redundant notifications. It integrates seamlessly with the platform’s Incident, Problem, and Change Management modules, ensuring a coherent operational workflow. The Certified Implementation Specialist – Event Management (CIS-EM) certification emphasizes mastery in configuring and utilizing this process, as it lies at the intersection of monitoring and remediation.
Through a detailed understanding of alert lifecycle management, alert correlation, prioritization, and visualization, professionals can transform ServiceNow Event Management from a passive observer into a proactive guardian of enterprise stability.
Understanding the Alert Lifecycle
The alert lifecycle in ServiceNow follows a structured progression that mirrors the operational response to an anomaly. Each alert undergoes several states, beginning with its creation and concluding with its closure or resolution.
When an event meets predefined criteria—such as exceeding a threshold or matching a correlation rule—it triggers the creation of an alert record. This record contains essential metadata including severity, category, originating source, and associated Configuration Item. The system then assesses the alert’s significance based on these attributes, determining whether it warrants escalation or automation.
Once created, alerts may transition through multiple statuses: new, acknowledged, investigating, resolved, or closed. Each state represents a distinct phase in the operational response cycle. Administrators and operators interact with these alerts through the operator workspace or directly via automated rules, ensuring accountability and traceability throughout the lifecycle.
The proper configuration of alert lifecycle rules is critical. By aligning these transitions with organizational processes, enterprises ensure consistency in their response strategies and compliance with internal governance frameworks.
Alert Prioritization and Severity Configuration
Every alert carries a severity level that communicates its potential impact on services. ServiceNow categorizes severities ranging from critical to informational, enabling teams to prioritize responses efficiently. Configuring these severity levels requires a nuanced understanding of business dependencies, performance baselines, and service-level expectations.
Alerts with a critical severity typically indicate an immediate threat to core operations, such as a server outage or application failure. Major or moderate alerts reflect partial degradation of service, while minor and informational alerts provide contextual awareness without immediate urgency.
The configuration of severity mapping ensures that event attributes align with organizational standards. This involves defining translation rules that convert incoming event severities from different monitoring tools into standardized ServiceNow values. Such mapping prevents discrepancies and ensures a uniform interpretation of alert importance across the enterprise.
Moreover, prioritization is not static. ServiceNow’s intelligent correlation mechanisms can dynamically adjust alert priorities based on dependencies or cascading impacts. For example, an alert affecting a critical business application may inherit a higher priority even if its originating event appears minor in isolation. This dynamic adjustment prevents misallocation of operational focus and maintains alignment with business-critical objectives.
Alert Correlation and Deduplication Strategies
Correlation and deduplication within the alert management process ensure efficiency by preventing redundancy and highlighting relationships among related alerts.
Alert correlation aggregates multiple related alerts into a single, composite record. This relationship may be established through common attributes such as message keys, source identifiers, or Configuration Item bindings. By grouping related alerts, correlation prevents fragmented visibility and enables operators to address the root cause rather than isolated symptoms.
Deduplication, in contrast, ensures that identical alerts generated repeatedly by the same condition are not treated as new incidents. The system updates the existing alert with new timestamps or activity data instead of creating duplicates. This conserves database efficiency and provides a consolidated record of recurring behavior, aiding in trend analysis.
Configuring correlation and deduplication rules requires precision. Overly broad rules can suppress important distinctions, while excessively narrow rules may fragment related alerts. The balance lies in understanding operational patterns, system interdependencies, and the behavioral nuances of event sources.
Managing Alert Groups and Related Records
Alert grouping enhances manageability by organizing alerts into cohesive structures based on logical relationships. ServiceNow allows administrators to configure grouping parameters such as service, location, application, or Configuration Item type.
Grouped alerts can be managed collectively, enabling bulk acknowledgment, reassignment, or resolution. This collective management reduces operational overhead, especially during large-scale incidents involving multiple related systems.
Additionally, alerts can be linked to incidents, problems, or changes automatically. This bidirectional linkage ensures synchronization between monitoring data and service management processes. When an alert triggers an incident, any subsequent updates—such as acknowledgment or resolution—are reflected across related records. This integration strengthens collaboration between monitoring and service operations teams.
Effective grouping and linkage configurations not only streamline workflow but also contribute to compliance, auditability, and consistent service reporting.
Visualizing Alerts in the Operator Workspace
The operator workspace remains the central interface for interacting with alerts. Within this environment, administrators can visualize alert metrics through customizable dashboards, widgets, and dynamic filters.
Alerts are displayed in real time, categorized by severity, source, or service impact. Operators can drill down into individual alerts to view detailed contextual information, including related events, recent updates, and associated Configuration Items.
The workspace supports advanced visualization techniques such as color-coded severity indicators, dependency maps, and performance charts. These graphical representations transform abstract data into intuitive insight, allowing operators to assess system health at a glance.
Customization plays a significant role in the operator workspace. Each organization can design dashboards tailored to its operational focus—whether infrastructure monitoring, application health, or service availability. Widgets can be configured to display KPIs, trends, or historical comparisons, enhancing decision-making accuracy.
Automating Alert Responses
Automation within alert management embodies the transition from reactive monitoring to proactive governance. Through predefined rules and workflows, ServiceNow can automatically initiate corrective actions upon alert generation.
Automations may include actions such as restarting a failed service, sending notifications to specific teams, or generating an incident record. More sophisticated configurations can integrate with orchestration tools, enabling end-to-end remediation workflows.
Event rules, alert action rules, and orchestration policies collectively define how automation behaves. These configurations must align with organizational risk tolerance, ensuring that automated responses do not inadvertently disrupt critical services.
Automation also supports time-based escalations. For instance, if a critical alert remains unresolved beyond a defined duration, the system can automatically escalate the issue to higher-level support teams. This ensures accountability and timeliness in response management.
The true value of automation lies in its ability to preserve human focus for analytical and strategic tasks while delegating repetitive, procedural actions to the system.
Integration with ITOM and ITSM Workflows
Alert management does not exist in isolation; it functions as a bridge between IT Operations Management (ITOM) and IT Service Management (ITSM).
When an alert triggers an incident, it creates a direct link between monitoring intelligence and service delivery. Incident records inherit contextual data from the alert, such as event source, affected Configuration Item, and severity level. This pre-populated data accelerates triage and resolution efforts.
Similarly, alerts can inform Problem Management processes by identifying recurring anomalies that warrant root-cause analysis. In Change Management, alerts can validate the impact of newly deployed modifications, ensuring that service stability remains intact.
This integration fosters a unified operational ecosystem, where monitoring, response, and governance operate in synchrony. It epitomizes the ServiceNow vision of holistic service awareness, ensuring that every operational signal contributes to the greater continuum of service excellence.
Alert Enrichment and Contextual Intelligence
Enrichment transforms raw alerts into contextualized intelligence by augmenting them with additional data. This can include business impact information, user details, or dependency insights.
Through enrichment rules, administrators can attach metadata to alerts automatically. For example, an alert affecting a financial application might include information about its revenue significance, associated user groups, or service-level commitments.
This contextual layering allows operators to assess not only the technical nature of an alert but also its business implications. It bridges the gap between infrastructure monitoring and organizational priorities.
Enrichment can also integrate with external data sources such as Configuration Management Databases, asset repositories, or third-party analytics platforms. This multidimensional intelligence equips decision-makers with a holistic understanding of incident significance and urgency.
Dynamic Thresholding and Predictive Alerting
Dynamic thresholding represents a leap forward from static alert configurations. Instead of relying on fixed numerical limits, dynamic thresholds adjust automatically based on real-time data patterns and historical baselines.
This adaptive behavior reduces false positives caused by temporary fluctuations while ensuring sensitivity to genuine anomalies. ServiceNow’s machine learning capabilities enhance this process by identifying trends and forecasting potential deviations.
Predictive alerting extends this intelligence by anticipating issues before they manifest. By analyzing performance trajectories and historical correlations, the system can generate alerts for conditions likely to breach thresholds in the near future.
Together, dynamic thresholding and predictive alerting embody the evolution of Event Management into a self-optimizing ecosystem—one that perceives, learns, and adapts continuously.
Event Sources and Integration Dynamics in ServiceNow Event Management
In ServiceNow Event Management, event sources are the conduits through which monitoring data enters the platform. They represent the foundation of the entire event-processing lifecycle, as every alert, correlation, and automation originates from an event transmitted by these sources. Understanding event sources is not merely a technical necessity—it is a strategic imperative for creating a unified, intelligent, and self-sustaining monitoring ecosystem.
An event source may be any system capable of generating or transmitting operational data related to performance, availability, capacity, or configuration. These sources encompass a broad spectrum, ranging from infrastructure-level monitoring tools to cloud-based analytics services. The diversity of these inputs ensures comprehensive visibility across all layers of the enterprise architecture.
For professionals pursuing the ServiceNow Certified Implementation Specialist – Event Management credential, mastery of event source configuration is a core competency. It bridges theoretical understanding with practical implementation, ensuring that monitoring data flows seamlessly into the ServiceNow ecosystem for processing, analysis, and action.
The Nature of Events and Their Origins
An event represents a discrete occurrence within a monitored system—an activity, anomaly, or change that warrants attention. Events can be as simple as a log entry or as complex as a multi-variable threshold breach in an application server.
Within ServiceNow, events are standardized into a common schema, regardless of their origin. This uniform structure allows the platform to process heterogeneous inputs consistently. Each event typically contains key attributes such as event source, message key, metric name, timestamp, severity, and additional contextual fields.
Event sources are responsible for generating or relaying these data points. They may include:
Network monitoring systems such as SolarWinds, Nagios, or Zabbix
Infrastructure management tools, including VMware vCenter or Microsoft System Center
Cloud monitoring services like AWS CloudWatch or Azure Monitor
Application performance platforms such as Dynatrace, AppDynamics, or New Relic
Log aggregation and analytics tools, including Splunk or Elastic Stack
Each source operates with its own data conventions and transmission protocols, making ServiceNow’s ability to normalize events a crucial differentiator. Through connectors, APIs, and inbound integrations, the platform transforms fragmented data into coherent operational intelligence.
Push and Pull Event Ingestion Methods
ServiceNow supports both push and pull mechanisms for event ingestion, allowing flexibility in integration strategies.
In the push method, external monitoring systems actively transmit event data to ServiceNow. This model is typically preferred when real-time responsiveness is paramount. Systems send events through HTTP POST requests, email messages, or integration hubs. The ServiceNow instance receives and processes them immediately, ensuring minimal latency between occurrence and detection.
Conversely, the pull method involves ServiceNow retrieving data from external systems at scheduled intervals. Through connectors or scripts, the platform queries monitoring tools and imports new or updated events. While this method introduces slight delays, it is advantageous for systems where event generation is continuous but not time-sensitive.
The choice between push and pull depends on the organization’s infrastructure architecture, network security policies, and operational priorities. Hybrid configurations are also possible, where critical systems use push integration while auxiliary systems employ pull methods for efficiency.
Inbound Actions and Data Handling
Inbound actions form the backbone of how ServiceNow interprets and processes incoming event data. These actions define how received payloads are parsed, validated, and converted into event records within the Event Management database.
When an event arrives, the system evaluates it against predefined event rules. These rules determine whether to accept, filter, or transform the event based on its attributes. For example, an inbound rule might instruct the system to discard events labeled as informational while retaining only warning and critical severities.
Inbound actions also govern field mapping. Each attribute from the source event—such as node name, metric type, or alert code—is mapped to corresponding fields in the ServiceNow event table. This structured mapping ensures uniformity and enables downstream processes such as correlation and CI binding.
Advanced users can extend inbound actions using scripting, allowing for conditional logic or data manipulation. Scripts can extract embedded values, standardize naming conventions, or enrich incoming events with additional context from the Configuration Management Database (CMDB).
Effective inbound configuration minimizes noise, enhances event fidelity, and preserves the integrity of operational analytics.
Configuring Monitoring Connectors
Monitoring connectors in ServiceNow act as bridges between external monitoring tools and the Event Management application. They streamline the integration process by providing preconfigured templates and communication protocols.
ServiceNow offers native connectors for many popular platforms, such as SCOM, SolarWinds, Splunk, AWS, and Azure. Each connector is designed to accommodate the specific data format and transmission method of its respective tool.
Configuration typically involves specifying connection parameters such as host address, credentials, and port settings. Once established, the connector continuously transmits or retrieves event data according to its configuration type.
For environments where no native connector exists, administrators can create custom connectors using REST APIs, MID Servers, or IntegrationHub spokes. Custom connectors offer immense flexibility, allowing ServiceNow to interface with proprietary or legacy systems without disrupting standard workflows.
The configuration process also involves setting event transformation rules to align with organizational data models. This ensures that incoming data is normalized before entering the Event Management pipeline.
The Role of the MID Server in Event Collection
The Management, Instrumentation, and Discovery (MID) Server plays a pivotal role in bridging the ServiceNow cloud environment with on-premises infrastructure. It acts as a secure communication channel for event collection, data discovery, and orchestration tasks.
When deployed, the MID Server resides within the organization’s network and facilitates data transmission between monitored systems and the ServiceNow instance. It ensures compliance with firewall restrictions, security policies, and data sovereignty requirements.
For event collection, the MID Server can execute scripts, query APIs, or receive SNMP traps from monitoring tools. It then forwards this information securely to the ServiceNow instance for processing.
Beyond event transmission, the MID Server contributes to event validation, dependency mapping, and CI binding. Maintaining proximity to monitored systems minimizes latency and enhances data accuracy.
The configuration of multiple MID Servers within a load-balanced or failover architecture further ensures scalability and resilience, enabling enterprises to handle high event volumes without degradation.
Normalization and Event Transformation
Event normalization is the process of converting heterogeneous event data into a consistent format recognizable by ServiceNow. Without normalization, the platform would struggle to correlate and analyze events from disparate sources.
Normalization involves translating field names, data types, and values into standardized equivalents. For instance, different monitoring tools may use varying labels for severity—such as “error,” “major,” or “critical.” ServiceNow normalization rules reconcile these variations into a unified severity scale.
Transformation complements normalization by adjusting data content to fit organizational needs. A transformation script might append service tags, modify host identifiers, or derive new values from existing attributes.
The Event Management application uses event rules and transformation maps to execute these processes dynamically. Properly configured normalization ensures that subsequent correlation, filtering, and alerting processes function seamlessly.
Event Filtering and Threshold Management
Filtering and thresholding represent the first defensive layer against event noise. In large-scale infrastructures, millions of events can be generated daily, and without intelligent filtering, operational visibility becomes clouded.
ServiceNow enables administrators to define event filters that selectively permit or suppress events based on conditions such as severity, source, or category. For example, events originating from test environments may be excluded from production monitoring.
Threshold management further refines this process by setting numerical limits on specific metrics. When a value surpasses its threshold, an event is generated. Adaptive thresholds—those that evolve with performance trends—offer an even more nuanced control, minimizing false positives while maintaining sensitivity.
Together, filtering and thresholding safeguard system stability, ensuring that only meaningful events advance through the management pipeline.
Dependency Mapping and CI Binding
Event sources are rarely isolated. Each one interacts with a complex web of applications, servers, and network components. Dependency mapping visualizes these relationships, enabling ServiceNow to trace event origins and assess downstream impacts.
Through CMDB integration, each event is bound to a corresponding Configuration Item (CI). This binding allows the system to determine which services are affected by a particular anomaly. For instance, an event from a database server may impact multiple applications that rely on it; CI binding reveals these relationships instantaneously.
Dependency maps generated within the operator workspace offer a graphical view of these associations. They provide operators with contextual insight into the broader implications of each event, supporting faster and more informed decision-making.
Security and Compliance in Event Source Configuration
Security considerations are paramount in event source management, especially in multi-environment infrastructures. Each integration must adhere to organizational data protection policies and regulatory standards.
ServiceNow employs encryption for all event data transmissions, ensuring that sensitive operational information remains protected. The use of MID Servers within secured network zones further enhances compliance by preventing direct inbound connections to the cloud instance.
Role-based access control (RBAC) restricts configuration and monitoring permissions to authorized personnel only. Additionally, audit trails record all integration activities, ensuring accountability and transparency.
For enterprises subject to stringent compliance frameworks, such as ISO 27001 or GDPR, these security measures ensure that monitoring processes remain lawful and auditable.
Event Enrichment through External Data Sources
Event enrichment augments incoming data with additional context, transforming raw events into meaningful intelligence. This may involve cross-referencing data from the CMDB, asset databases, or third-party analytics systems.
For instance, an event indicating high CPU utilization on a virtual machine can be enriched with information about the business service it supports, the responsible application owner, and its service-level agreement. This context enables faster triage and more accurate prioritization.
ServiceNow’s enrichment policies operate automatically, applying conditional logic to attach relevant metadata to events as they are processed. This dynamic intelligence ensures that every alert carries not just technical, but also organizational significance.
Advanced Implementation Strategies and Operational Mastery in ServiceNow Event Management
Advanced implementation in ServiceNow Event Management transcends basic setup and configuration, emphasizing optimization, scalability, and strategic alignment with organizational objectives. At this stage, the Certified Implementation Specialist – Event Management integrates technical proficiency with operational insight, ensuring that every event, alert, and workflow contributes to sustained service excellence.
The complexity of modern IT environments, characterized by hybrid clouds, multi-tier applications, and diverse monitoring systems, demands a sophisticated approach. Effective implementation aligns Event Management with IT Operations Management (ITOM) and IT Service Management (ITSM) frameworks, transforming raw data streams into actionable intelligence that supports proactive decision-making, predictive maintenance, and business resilience.
Optimizing Event Processing Workflows
Event processing forms the backbone of Event Management. Optimizing these workflows requires careful attention to sequence, rules configuration, and resource allocation.
The process begins with ingestion, where events from various sources are captured. Optimization entails ensuring that event pipelines are load-balanced and capable of handling peak volumes without latency. This may involve deploying multiple MID Servers or configuring asynchronous processing jobs to distribute workload efficiently.
Event rules and thresholds should be periodically reviewed to maintain alignment with evolving system behaviors. Rules must strike a balance between sensitivity and specificity, avoiding both excessive false positives and missed anomalies. Thresholds may be dynamically adjusted using historical trends and predictive analytics, ensuring that alert generation reflects true operational risk.
Normalization and field mapping remain critical in optimizing workflows. Standardizing data formats from diverse sources enables seamless correlation, deduplication, and CI binding, which in turn supports more accurate alerting and reporting.
Leveraging Alert Intelligence for Proactive Management
Alert intelligence represents the intersection of analytical rigor and operational foresight. It utilizes historical patterns, predictive models, and correlation rules to provide early warning signals and guide prioritization.
Advanced configurations may incorporate machine learning algorithms to identify recurring patterns, predict service degradation, and recommend automated remediation. For example, the system may detect subtle anomalies in server metrics that historically precede downtime and trigger preventive actions.
Dependency mapping enhances alert intelligence by contextualizing each alert within the broader service architecture. By understanding how a single event propagates across dependent services, operators can prioritize interventions that minimize business impact.
Additionally, alert intelligence facilitates the continuous refinement of correlation and deduplication rules. By analyzing aggregated data, administrators can identify rule inefficiencies, adjust thresholds, and improve the accuracy of grouped alerts.
Integration with ITSM and ITOM Workflows
Advanced Event Management implementation extends beyond monitoring to operational orchestration. Integration with ITSM workflows, such as Incident, Problem, and Change Management, ensures that alerts directly inform service operations.
For instance, a critical alert from a database server can automatically generate an incident, pre-populating it with contextual data including the affected service, associated Configuration Items, and historical event trends. Problem Management can leverage recurring alert data to identify root causes, while Change Management can validate the impact of proposed modifications against historical event patterns.
Similarly, integration with ITOM modules, including Discovery, Service Mapping, and Orchestration, enhances visibility and automation. Discovery updates ensure that Configuration Items remain accurate, while Service Mapping contextualizes alerts within the service hierarchy. Orchestration enables automated remediation actions, reducing mean time to resolution and improving operational efficiency.
Automation and Orchestration Strategies
Automation is a cornerstone of advanced Event Management. Beyond basic notifications, automation can execute complex remediation tasks, trigger multi-step workflows, and enforce operational policies.
Orchestration extends automation by coordinating across multiple systems, tools, and teams. For example, upon detecting a failed virtual machine, an orchestration workflow might automatically initiate a restart, validate dependent services, and notify relevant stakeholders.
The design of these workflows requires a deep understanding of infrastructure interdependencies, business priorities, and compliance considerations. Automation scripts—implemented in JavaScript, PowerShell, or via MID Server execution—must be carefully tested to avoid unintended disruptions.
Time-based escalation policies complement automation by ensuring that unresolved critical alerts are escalated to higher-level support teams. This layered approach guarantees responsiveness, accountability, and continuity of service.
Monitoring and Reporting Enhancements
Advanced implementation emphasizes sophisticated monitoring and reporting capabilities. Dashboards and analytics provide real-time visibility into system health, alert trends, and service impact.
Customizable widgets, dependency visualizations, and trend charts enable operators to focus on critical areas while maintaining holistic situational awareness. Historical reporting supports performance analysis, SLA compliance monitoring, and capacity planning.
Predictive reporting leverages machine learning to forecast potential incidents, resource bottlenecks, and service degradation. By integrating these insights into operational planning, organizations can shift from reactive management to proactive governance.
Security and Compliance Considerations
As Event Management extends across diverse systems and environments, security and compliance become paramount. Proper configuration ensures that sensitive event data is encrypted in transit and at rest. MID Servers, positioned within secure network zones, facilitate controlled data flow without exposing the ServiceNow instance to external vulnerabilities.
Role-based access control governs who can configure connectors, modify rules, or interact with sensitive alert data. Audit logs provide a detailed record of all activities, supporting accountability and regulatory compliance.
For organizations subject to regulatory frameworks such as GDPR, ISO 27001, or SOX, adherence to these security and governance practices ensures that Event Management operations remain compliant and auditable.
Continuous Improvement and Optimization
Advanced implementation is not a one-time activity; it is an ongoing process of refinement and enhancement. Regular reviews of event rules, alert thresholds, correlation strategies, and CI bindings ensure that the Event Management system adapts to infrastructure changes and evolving business requirements.
Performance metrics, including event processing latency, alert accuracy, and mean time to resolution, provide quantitative measures for continuous improvement. Administrators can leverage these metrics to fine-tune configurations, optimize workflows, and enhance predictive capabilities.
Feedback loops, informed by operator experience and operational outcomes, drive iterative improvement. By analyzing false positives, missed alerts, and system bottlenecks, teams can implement targeted adjustments that enhance both efficiency and reliability.
Conclusion
The ServiceNow Event Management ecosystem is a comprehensive framework that transforms the deluge of operational data into actionable intelligence, bridging the gap between IT operations and business objectives. The platform’s intricacies—from event ingestion and processing to alert management, correlation, and advanced implementation—demonstrate how precision, context, and automation collectively drive service excellence. Each stage of the Event Management lifecycle, from configuring event sources to leveraging alert intelligence, underscores the importance of structured workflows, normalized data, and strategic integration with ITSM and ITOM processes. Mastery of event processing ensures that raw events are filtered, normalized, and transformed into meaningful alerts that reflect the true operational state. Alert management, enriched with dependency mapping and predictive analytics, prioritizes critical issues while minimizing noise, enabling proactive decision-making. The configuration of connectors, MID Servers, and inbound actions facilitates seamless integration with diverse monitoring tools, while automation and orchestration empower rapid, reliable remediation.
Advanced implementation strategies emphasize scalability, security, and continuous improvement, ensuring that Event Management evolves alongside organizational growth. By aligning monitoring with business services, predictive modeling, and operational intelligence, organizations achieve a resilient, self-optimizing system capable of anticipating disruptions and minimizing downtime. Ultimately, ServiceNow Event Management is not merely a monitoring tool—it is a strategic enabler of operational efficiency, business continuity, and informed decision-making. Professionals who develop proficiency across its multifaceted capabilities play a pivotal role in converting data into insight, challenges into solutions, and system complexity into structured, actionable intelligence. This mastery fosters sustained service reliability, operational excellence, and a proactive culture of IT and business alignment.
Frequently Asked Questions
Where can I download my products after I have completed the purchase?
Your products are available immediately after you have made the payment. You can download them from your Member's Area. Right after your purchase has been confirmed, the website will transfer you to Member's Area. All you will have to do is login and download the products you have purchased to your computer.
How long will my product be valid?
All Testking products are valid for 90 days from the date of purchase. These 90 days also cover updates that may come in during this time. This includes new questions, updates and changes by our editing team and more. These updates will be automatically downloaded to computer to make sure that you get the most updated version of your exam preparation materials.
How can I renew my products after the expiry date? Or do I need to purchase it again?
When your product expires after the 90 days, you don't need to purchase it again. Instead, you should head to your Member's Area, where there is an option of renewing your products with a 30% discount.
Please keep in mind that you need to renew your product to continue using it after the expiry date.
How often do you update the questions?
Testking strives to provide you with the latest questions in every exam pool. Therefore, updates in our exams/questions will depend on the changes provided by original vendors. We update our products as soon as we know of the change introduced, and have it confirmed by our team of experts.
How many computers I can download Testking software on?
You can download your Testking products on the maximum number of 2 (two) computers/devices. To use the software on more than 2 machines, you need to purchase an additional subscription which can be easily done on the website. Please email support@testking.com if you need to use more than 5 (five) computers.
What operating systems are supported by your Testing Engine software?
Our testing engine is supported by all modern Windows editions, Android and iPhone/iPad versions. Mac and IOS versions of the software are now being developed. Please stay tuned for updates if you're interested in Mac and IOS versions of Testking software.


