Certification: Cisco AppDynamics Associate Administrator
Certification Full Name: Cisco AppDynamics Associate Administrator
Certification Provider: Cisco
Exam Code: 500-425
Exam Name: Cisco AppDynamics Associate Administrator
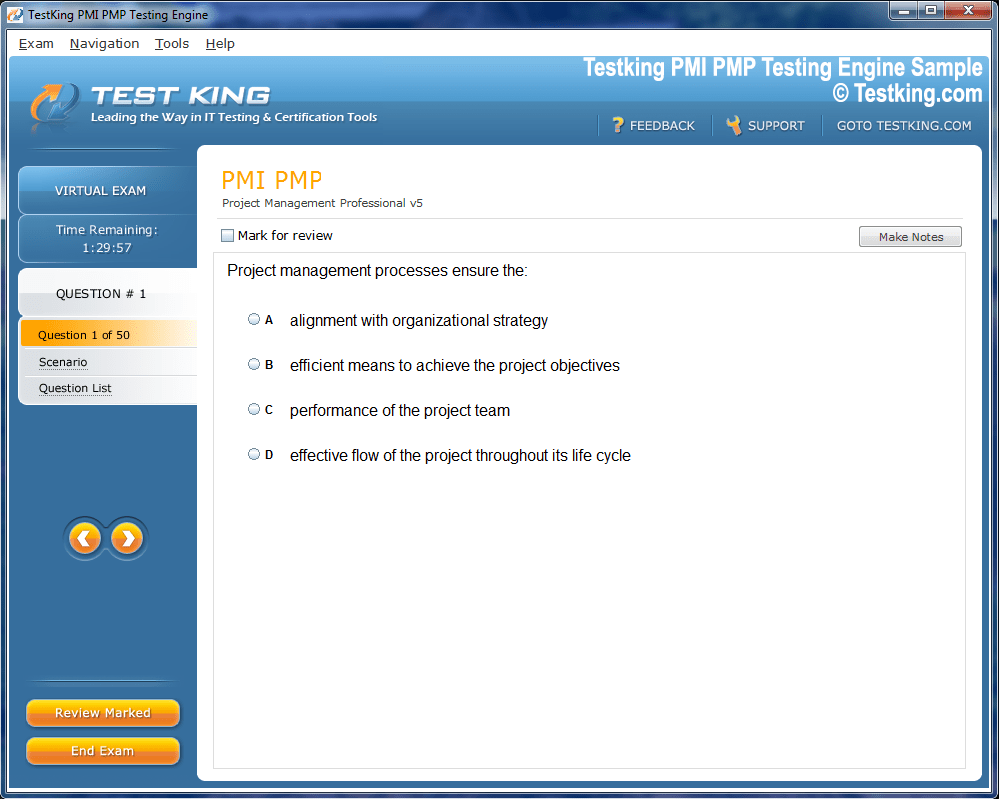
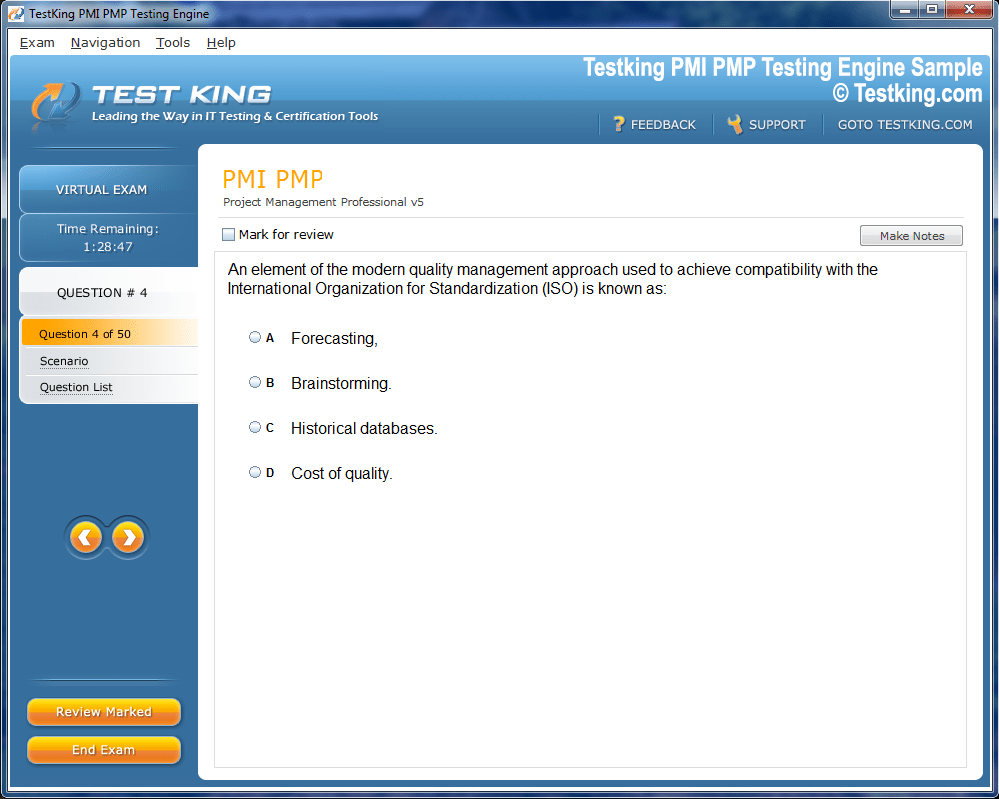
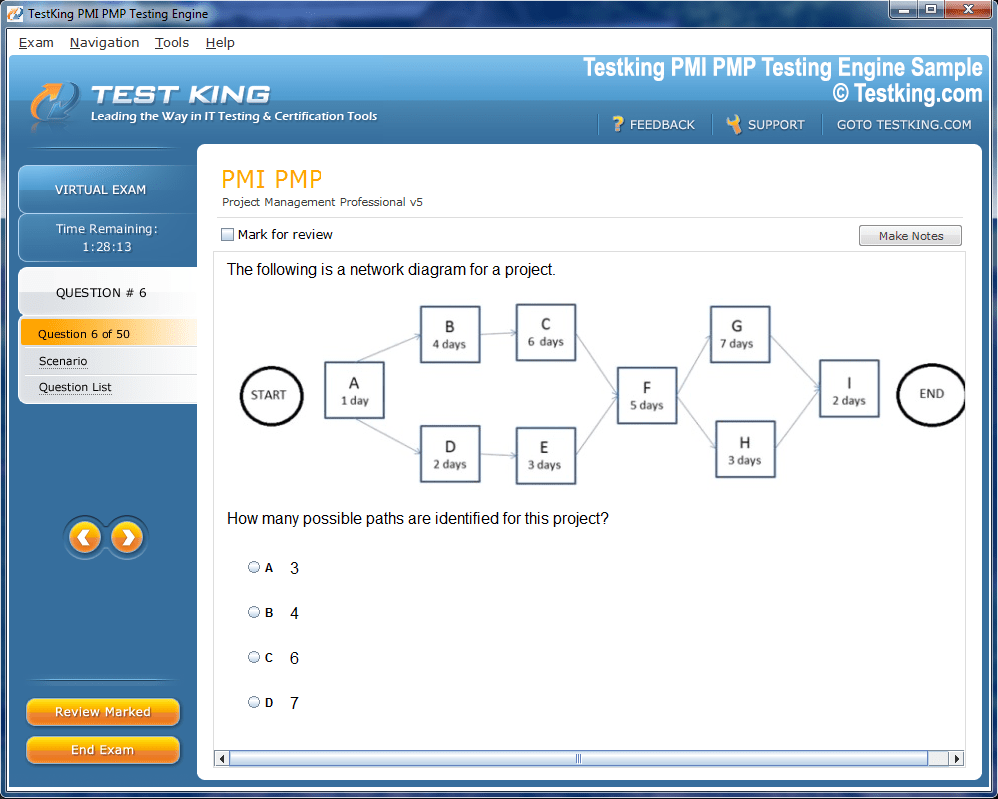
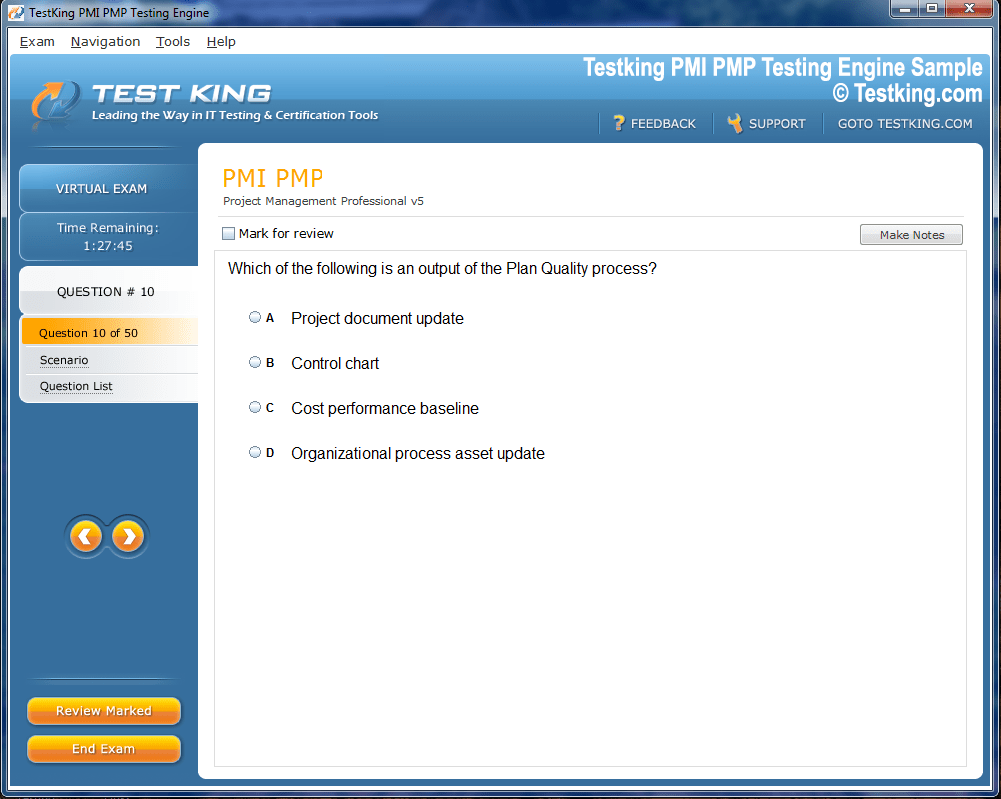
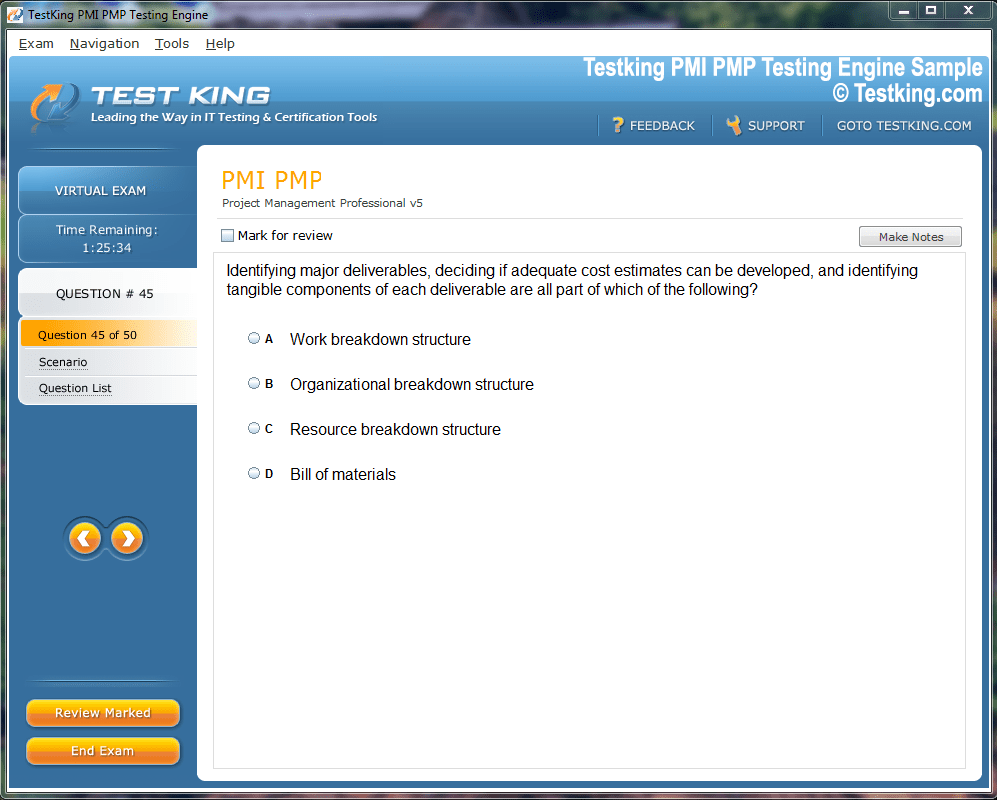
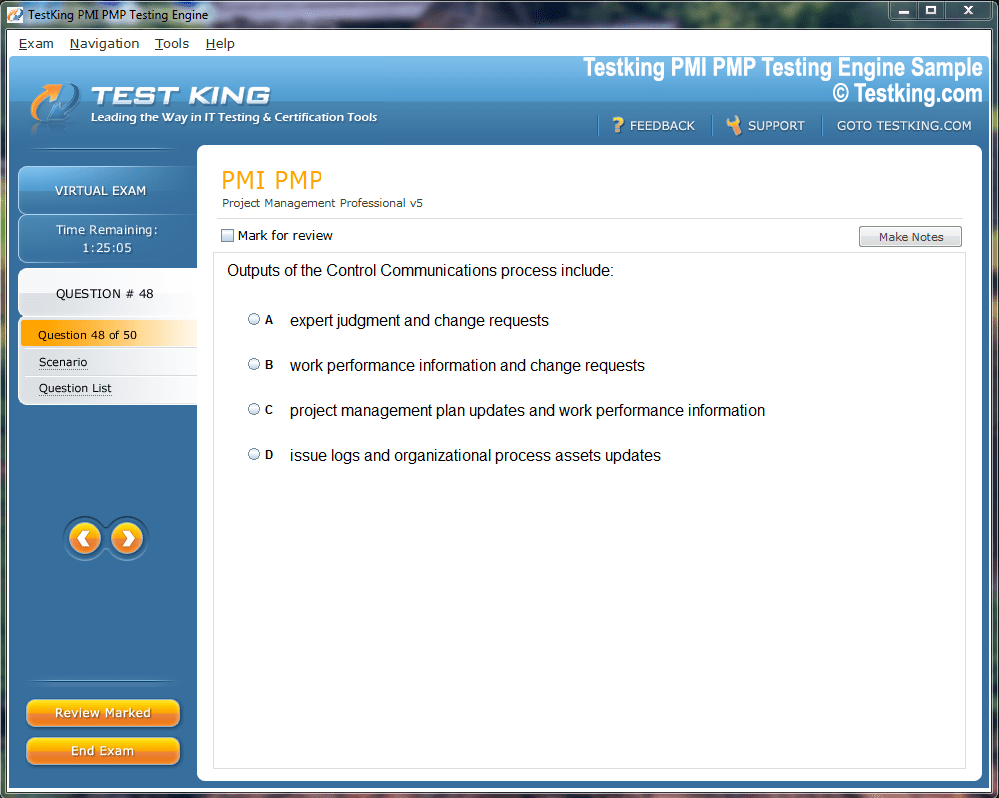
Product Screenshots
nop-1e =1
Preparing for the Cisco AppDynamics Associate Administrator Certification: What You Need to Know
Application performance monitoring represents a critical discipline within modern enterprise technology infrastructure. This comprehensive approach involves systematic observation, measurement, and analysis of software applications during their operational lifecycle. Organizations implementing robust monitoring solutions experience significantly improved user satisfaction rates, reduced downtime incidents, and enhanced operational efficiency across distributed computing environments.
The evolution of application architectures toward microservices, containerization, and cloud-native deployments has fundamentally transformed monitoring requirements. Traditional monitoring approaches often prove inadequate when dealing with complex, interconnected systems spanning multiple geographic regions, cloud providers, and technology stacks. Modern application performance monitoring solutions must provide granular visibility into transaction flows, dependency mapping, and real-time performance metrics across heterogeneous environments.
Contemporary enterprises rely heavily on digital services to deliver customer experiences, process business transactions, and maintain competitive advantages. Any degradation in application performance directly translates to revenue loss, customer churn, and operational inefficiencies. Comprehensive monitoring strategies enable proactive identification of performance bottlenecks, capacity planning insights, and data-driven optimization decisions.
The complexity of modern application ecosystems demands sophisticated monitoring capabilities that extend beyond simple uptime checks or basic resource utilization metrics. Effective performance monitoring encompasses end-user experience measurement, application topology discovery, dependency analysis, and intelligent anomaly detection. These capabilities collectively enable organizations to maintain optimal application performance while minimizing operational overhead and reducing mean time to resolution for performance-related incidents.
Exploring the AppDynamics Platform Architecture
The AppDynamics platform employs a sophisticated architecture designed to handle enterprise-scale monitoring requirements across diverse technology environments. At its core, the platform consists of multiple interconnected components working collaboratively to provide comprehensive visibility into application performance, user experiences, and infrastructure health.
The controller serves as the central nervous system of the AppDynamics deployment, responsible for data aggregation, analysis, storage, and presentation. This component processes massive volumes of performance data collected from monitored applications, applying advanced analytics algorithms to identify patterns, anomalies, and performance trends. The controller maintains historical performance baselines, enabling accurate deviation detection and predictive analytics capabilities.
Application agents represent distributed monitoring components deployed alongside monitored applications. These lightweight agents automatically instrument application code, collecting detailed performance metrics without requiring significant modifications to existing applications. Agents support numerous programming languages, frameworks, and runtime environments, ensuring broad compatibility across heterogeneous enterprise technology stacks.
The machine agent provides infrastructure-level monitoring capabilities, collecting system-level metrics including CPU utilization, memory consumption, network performance, and storage operations. This component bridges the gap between application-level monitoring and infrastructure visibility, enabling correlation between application performance issues and underlying system resource constraints.
Database agents extend monitoring capabilities to database management systems, providing detailed insights into query performance, connection pool utilization, and database-specific metrics. These specialized agents support major database platforms including Oracle, SQL Server, MySQL, PostgreSQL, and various NoSQL databases, ensuring comprehensive database performance visibility.
Network agents monitor network infrastructure components, tracking bandwidth utilization, latency metrics, and connectivity issues that may impact application performance. These agents provide crucial visibility into network-related performance bottlenecks, enabling rapid identification and resolution of connectivity-related issues.
Application Performance Monitoring Benefits and Use Cases
Implementing comprehensive application performance monitoring delivers substantial benefits across multiple organizational dimensions. These advantages extend beyond technical improvements to encompass business outcomes, operational efficiency gains, and strategic competitive advantages.
Proactive issue identification represents one of the most significant benefits of effective monitoring implementations. Rather than relying on reactive approaches triggered by user complaints or system failures, comprehensive monitoring enables early detection of performance degradation patterns. This proactive capability allows technical teams to address potential issues before they impact end-user experiences or business operations.
Root cause analysis capabilities provided by advanced monitoring platforms dramatically reduce troubleshooting time and operational overhead. When performance issues occur, detailed transaction tracing, dependency mapping, and correlation analysis enable rapid identification of underlying causes. This accelerated problem resolution directly translates to reduced downtime, improved user satisfaction, and lower operational costs.
Capacity planning and resource optimization represent strategic benefits that deliver long-term value to organizations. Comprehensive monitoring provides detailed insights into resource utilization patterns, growth trends, and peak demand characteristics. This information enables data-driven decisions regarding infrastructure scaling, resource allocation, and technology investments.
User experience optimization becomes achievable through detailed visibility into end-user interactions with applications. Monitoring platforms can track user journeys, identify friction points, and measure key performance indicators directly related to user satisfaction. These insights enable targeted optimization efforts that improve conversion rates, reduce user abandonment, and enhance overall customer experiences.
Business impact correlation capabilities enable organizations to understand the relationship between technical performance metrics and business outcomes. By tracking key business metrics alongside technical performance indicators, organizations can quantify the business value of performance optimization initiatives and prioritize improvement efforts based on potential business impact.
Technology Stack Requirements and Compatibility
Successful AppDynamics implementations require careful consideration of technology stack compatibility and infrastructure requirements. The platform supports an extensive range of programming languages, frameworks, application servers, and infrastructure components, ensuring broad compatibility across enterprise environments.
Java-based applications represent one of the most comprehensively supported categories within the AppDynamics ecosystem. The Java agent provides deep visibility into Java Virtual Machine performance, garbage collection activities, thread pool utilization, and application-specific metrics. Support extends across major Java frameworks including Spring, Hibernate, Struts, and numerous others commonly used in enterprise application development.
Microsoft .NET applications benefit from specialized agent capabilities designed specifically for the .NET ecosystem. The .NET agent supports both Framework and Core implementations, providing detailed performance insights for ASP.NET applications, WCF services, and various other .NET-based technologies. Integration with Microsoft technologies includes support for Internet Information Services, SQL Server, and Azure cloud services.
Node.js applications increasingly prevalent in modern development practices are fully supported through specialized agent implementations. The Node.js agent provides visibility into event loop performance, asynchronous operation tracking, and popular Node.js frameworks including Express, Koa, and various others commonly used in contemporary web application development.
Python applications benefit from comprehensive monitoring capabilities through dedicated Python agents. Support encompasses major Python web frameworks including Django, Flask, and Pyramid, along with various data processing frameworks and libraries commonly used in enterprise Python deployments.
PHP applications, despite being considered legacy technology by some organizations, maintain substantial presence in enterprise environments. AppDynamics provides specialized PHP agents supporting major frameworks including Laravel, Symfony, and CodeIgniter, ensuring comprehensive monitoring capabilities for organizations maintaining PHP-based applications.
Database compatibility encompasses major relational database management systems including Oracle, SQL Server, MySQL, PostgreSQL, and DB2. NoSQL database support includes MongoDB, Cassandra, Redis, and various other modern database technologies increasingly adopted in contemporary application architectures.
Infrastructure and Cloud Platform Integration
Modern application deployments increasingly leverage cloud platforms and containerized architectures, requiring monitoring solutions that provide comprehensive visibility across hybrid and multi-cloud environments. AppDynamics delivers extensive integration capabilities with major cloud providers and container orchestration platforms.
Amazon Web Services integration provides native support for various AWS services including EC2 instances, RDS databases, Lambda functions, and container services. The platform automatically discovers AWS resources, maps dependencies, and correlates application performance with underlying AWS service metrics. This integration enables unified visibility across on-premises and AWS-hosted application components.
Microsoft Azure integration delivers similar capabilities for organizations leveraging Azure cloud services. Support encompasses Azure Virtual Machines, Azure SQL Database, Azure App Service, and various other Azure platform services. The integration provides automated discovery and monitoring of Azure resources, enabling comprehensive visibility across hybrid Azure deployments.
Google Cloud Platform support ensures organizations utilizing GCP services receive comprehensive monitoring capabilities. Integration includes Google Compute Engine, Google Kubernetes Engine, Cloud SQL, and various other GCP services commonly used in enterprise application deployments.
Container orchestration platforms including Kubernetes and Docker Swarm receive specialized support through container-aware monitoring capabilities. The platform automatically discovers container deployments, tracks container lifecycle events, and monitors containerized application performance. Integration with Kubernetes provides namespace-aware monitoring, pod-level visibility, and correlation with Kubernetes cluster metrics.
Microservices architectures benefit from specialized monitoring capabilities designed to handle distributed system complexity. The platform automatically discovers service dependencies, tracks inter-service communications, and provides service-level performance metrics. This capability proves essential for organizations adopting microservices patterns where traditional monitoring approaches often prove inadequate.
Installation and Deployment Planning Strategies
Successful AppDynamics deployments require comprehensive planning addressing architecture decisions, sizing requirements, security considerations, and operational procedures. Proper planning ensures optimal performance, scalability, and maintainability of the monitoring infrastructure.
Controller sizing and placement decisions significantly impact overall monitoring system performance and reliability. Organizations must consider factors including expected agent populations, data retention requirements, geographic distribution of monitored applications, and anticipated growth patterns. Controller sizing recommendations vary based on monitoring scope, with larger deployments potentially requiring enterprise-grade hardware specifications and high-availability configurations.
Network connectivity requirements encompass bidirectional communication between agents and controllers, database connectivity for data persistence, and external integrations with various enterprise systems. Organizations must ensure adequate network bandwidth, proper firewall configurations, and secure communication channels between monitoring components.
Security considerations include authentication mechanisms, role-based access controls, data encryption requirements, and compliance with organizational security policies. The platform supports integration with enterprise identity management systems, enabling centralized user authentication and authorization. Data encryption capabilities protect sensitive performance data both in transit and at rest.
High availability and disaster recovery planning ensures monitoring system resilience during outages or disaster scenarios. Organizations should implement appropriate backup strategies, failover mechanisms, and recovery procedures to maintain monitoring capabilities during adverse events. Multi-controller deployments and geographic distribution of monitoring infrastructure components can enhance overall system resilience.
Agent Deployment Methodologies and Best Practices
Agent deployment represents a critical phase in AppDynamics implementation, requiring careful consideration of deployment strategies, configuration management, and ongoing maintenance procedures. Effective agent deployment ensures comprehensive monitoring coverage while minimizing operational overhead and application performance impact.
Automated deployment strategies leverage configuration management tools, container orchestration platforms, and infrastructure automation frameworks to streamline agent installation and configuration processes. Organizations can integrate agent deployment with existing continuous integration and deployment pipelines, ensuring newly deployed applications automatically receive monitoring instrumentation.
Manual deployment approaches may be appropriate for smaller environments or specialized applications requiring customized monitoring configurations. Manual deployment provides granular control over agent configurations and enables targeted deployment to specific application instances based on business priorities or technical requirements.
Container-based deployments require specialized approaches accommodating container lifecycle management, orchestration platform integration, and dynamic scaling characteristics. Agent deployment in containerized environments often involves building monitoring capabilities directly into container images or utilizing sidecar patterns for agent deployment alongside application containers.
Configuration management ensures consistent agent configurations across application instances while accommodating environment-specific requirements. Organizations should establish standardized configuration templates, implement configuration validation procedures, and maintain configuration documentation to ensure consistent monitoring behavior across environments.
User Interface Navigation and Dashboard Customization
The AppDynamics user interface provides comprehensive visibility into application performance through intuitive navigation structures and customizable dashboards. Effective utilization of the user interface enables rapid access to critical performance information and efficient troubleshooting workflows.
The main navigation structure organizes monitoring information into logical categories including applications, servers, databases, and business transactions. Each category provides specialized views optimized for specific monitoring use cases, enabling users to quickly locate relevant information based on their operational responsibilities.
Dashboard customization capabilities enable organizations to create tailored views addressing specific monitoring requirements, stakeholder needs, and operational workflows. Custom dashboards can combine metrics from multiple sources, provide executive-level summaries, or deliver detailed technical insights for specific application components.
Widget libraries provide pre-built visualization components for common monitoring scenarios including response time trends, error rate summaries, throughput metrics, and infrastructure health indicators. Organizations can combine these widgets to create comprehensive monitoring dashboards addressing various stakeholder requirements.
Alerting and notification customization ensures appropriate stakeholders receive timely notifications regarding performance issues or anomalous behavior. The platform supports multiple notification channels including email, SMS, and integration with incident management systems commonly used in enterprise operations.
Data Collection and Metric Aggregation Mechanisms
AppDynamics employs sophisticated data collection and aggregation mechanisms designed to handle massive volumes of performance data while maintaining system responsiveness and providing actionable insights. Understanding these mechanisms enables optimal utilization of monitoring capabilities and informed configuration decisions.
Real-time data collection occurs continuously as agents monitor application and infrastructure components. This continuous collection enables immediate detection of performance anomalies and rapid response to critical issues. The platform employs intelligent sampling techniques to balance data completeness with system performance impact.
Data aggregation processes combine raw performance measurements into meaningful metrics suitable for analysis and visualization. Aggregation occurs at multiple levels including transaction-level summaries, time-based rollups, and cross-application correlations. These aggregated metrics provide the foundation for performance analysis, trend identification, and capacity planning activities.
Historical data retention policies balance storage requirements with analytical capabilities. Organizations can configure retention periods based on compliance requirements, analytical needs, and storage capacity constraints. The platform supports tiered storage approaches where detailed data is retained for shorter periods while summary metrics are maintained for extended periods.
Baseline Establishment and Performance Thresholds
Establishing accurate performance baselines and appropriate threshold configurations represents a fundamental requirement for effective monitoring implementations. Proper baseline establishment enables accurate anomaly detection while minimizing false positive alerts that can overwhelm operational teams.
Automated baseline learning algorithms analyze historical performance patterns to establish normal operating ranges for various metrics. These algorithms accommodate natural variation in application performance while identifying significant deviations that may indicate performance issues. The platform continuously refines baselines based on ongoing performance observations.
Manual threshold configuration provides granular control over alert conditions for specific metrics or application components. Organizations can establish custom thresholds based on business requirements, service level agreements, or operational constraints. Manual configuration proves particularly valuable for business-critical applications requiring precise performance monitoring.
Dynamic threshold adjustment capabilities automatically modify alert thresholds based on changing application behavior patterns. This capability proves essential for applications experiencing seasonal usage variations, gradual performance degradation, or evolving operational characteristics.
Statistical analysis techniques enable sophisticated threshold management accounting for natural variation in performance metrics. The platform can apply statistical methods to distinguish between normal performance fluctuations and genuinely anomalous behavior requiring operational attention.
Advanced Configuration Options and Customizations
Advanced configuration capabilities enable organizations to tailor AppDynamics behavior to address specific monitoring requirements, organizational constraints, and operational preferences. Effective utilization of advanced configurations maximizes monitoring value while optimizing system resource utilization.
Custom metric definition allows organizations to track business-specific or application-specific performance indicators beyond standard platform metrics. Organizations can define custom metrics based on application logs, business transactions, or external data sources, enabling comprehensive monitoring coverage addressing unique organizational requirements.
Agent configuration tuning enables optimization of monitoring overhead, data collection granularity, and system resource utilization. Organizations can adjust sampling rates, modify instrumentation scope, and configure data collection intervals to balance monitoring completeness with application performance impact.
Integration configuration enables connectivity with external systems including incident management platforms, notification systems, and business intelligence tools. These integrations extend monitoring capabilities beyond standalone performance visibility to encompass broader operational workflows and business processes.
Security configuration options address authentication, authorization, data encryption, and compliance requirements. Organizations can implement enterprise-grade security controls ensuring monitoring data remains protected while enabling appropriate access for operational teams.
Troubleshooting Common Implementation Challenges
AppDynamics implementations may encounter various challenges requiring systematic troubleshooting approaches and resolution strategies. Understanding common implementation issues and their solutions enables successful deployments and optimal ongoing operations.
Agent connectivity issues represent frequent challenges during initial deployments. These issues often stem from network configuration problems, firewall restrictions, or authentication failures. Systematic troubleshooting involves verifying network connectivity, validating firewall rules, and confirming authentication credentials.
Performance impact concerns may arise when monitoring overhead affects application response times or resource utilization. Resolution strategies include agent configuration tuning, sampling rate adjustment, and selective instrumentation of critical application components. Organizations should establish performance impact baselines and monitor monitoring overhead as part of ongoing operations.
Data collection gaps can result from incomplete agent deployment, configuration errors, or application-specific instrumentation challenges. Systematic validation of agent deployment, configuration verification, and application-specific troubleshooting ensures comprehensive monitoring coverage.
Integration challenges with existing enterprise systems may require custom configuration, API utilization, or workflow modifications. Organizations should plan integration requirements during initial implementation phases and allocate appropriate resources for integration development and testing.
Performance Optimization and Scalability Considerations
Optimizing AppDynamics performance and ensuring scalability requires ongoing attention to system resource utilization, configuration optimization, and capacity planning. Effective performance optimization ensures monitoring systems can accommodate organizational growth while maintaining responsiveness and accuracy. Since AppDynamics is often deployed across distributed, mission-critical applications, performance optimization is not just about reducing resource overhead—it is about ensuring the observability solution itself scales in parallel with the organization’s digital ecosystem.
Controller Performance Optimization
The AppDynamics Controller is the central management hub of the entire monitoring ecosystem, responsible for collecting, storing, analyzing, and visualizing data. Any performance bottleneck at the controller level can degrade monitoring accuracy, slow down alerting, and ultimately impact troubleshooting effectiveness.
Hardware Sizing: Proper hardware sizing is essential to ensure the controller has enough computing power, memory, and storage resources to handle data ingestion at scale. Organizations should follow Cisco’s official hardware sizing guidelines, but also monitor usage metrics closely to anticipate when resource expansion is necessary. For large enterprise environments, deploying a clustered controller setup can distribute the load and enhance reliability.
Database Tuning: Since the controller stores monitoring data in a database, database optimization plays a key role in performance. Regular index maintenance, query performance analysis, and database parameter tuning prevent slowdowns caused by inefficient queries or data fragmentation. Organizations should also implement database replication and backup strategies that safeguard data integrity without causing excessive I/O overhead.
Configuration Parameter Adjustment: Fine-tuning configuration settings such as data retention periods, dashboard refresh intervals, and background job scheduling helps reduce unnecessary load on the controller. By balancing system responsiveness with data processing requirements, organizations can maintain a healthy performance baseline.
Performance Reviews: Regular health checks and performance reviews should be scheduled to detect emerging bottlenecks before they escalate. Organizations can integrate AppDynamics’ own self-monitoring features to track controller health and proactively implement adjustments.
Agent Performance Tuning
AppDynamics agents are deployed across applications, servers, databases, and network devices to collect telemetry data. While these agents are lightweight by design, inefficient configuration can result in unnecessary resource consumption.
Instrumentation Granularity: Adjusting the level of instrumentation allows organizations to control the trade-off between detail and performance impact. For critical applications, high granularity ensures in-depth visibility, whereas less critical components can be monitored at lower detail to reduce overhead.
Sampling Rates: Modifying transaction sampling rates can significantly optimize resource utilization. For example, instead of capturing 100% of transactions, organizations can capture a statistically significant subset that provides meaningful insights while reducing processing overhead.
Selective Feature Enablement: Not all monitoring features are necessary for every application. Organizations should selectively enable features like end-user monitoring (EUM), analytics, or advanced diagnostics only where they provide measurable value. This approach prevents unnecessary strain on application and infrastructure resources.
Performance Impact Assessments: Regular testing of agent performance impact should be conducted in controlled environments. By simulating peak loads and comparing system behavior with and without agents, organizations can ensure monitoring overhead remains within acceptable thresholds.
Network Optimization Strategies
Efficient communication between monitoring components is critical to ensure timely data delivery and real-time insights. Poor network optimization can lead to delayed alerts, inaccurate metrics, or even data loss.
Bandwidth Utilization: AppDynamics data traffic should be evaluated regularly to avoid network congestion. Where possible, dedicated network segments or Quality of Service (QoS) policies can prioritize monitoring traffic, ensuring observability data flows smoothly during peak application loads.
Data Compression: Leveraging compression techniques reduces the volume of transmitted data without sacrificing accuracy. This is particularly important in hybrid or cloud environments where monitoring data must traverse WAN links.
Communication Efficiency: Reducing unnecessary agent-to-controller chatter through optimized configuration reduces both latency and bandwidth consumption. Organizations should implement secure but lightweight communication protocols to balance performance with compliance requirements.
Storage Optimization
The storage requirements of AppDynamics can expand rapidly as organizations scale their monitoring footprint. Without proper optimization, storage costs can balloon, and query performance can degrade.
Data Retention Policies: Implementing tiered data retention policies ensures high-resolution data is kept for shorter periods, while aggregated summaries are stored long term. This strikes a balance between detailed analysis and storage efficiency.
Archival Strategies: Archiving older monitoring data to lower-cost storage tiers (e.g., object storage or cold storage) helps reduce primary storage utilization while preserving access for compliance or forensic analysis.
Database Maintenance: Proactive database maintenance, including index optimization, defragmentation, and regular cleanup of obsolete records, improves query performance and reduces storage overhead.
Capacity Planning: Organizations should forecast storage growth based on historical data trends and anticipated monitoring expansion. Implementing predictive capacity planning helps avoid unexpected storage shortages that can disrupt monitoring operations.
Security and Compliance Considerations in Performance Optimization
Performance optimization and scalability cannot be separated from security and compliance. Organizations must ensure that optimization strategies do not compromise the confidentiality, integrity, or availability of monitoring data.
Encryption Overhead: While data encryption (in transit and at rest) is non-negotiable, it introduces additional computational overhead. Organizations should carefully evaluate cryptographic algorithms and hardware acceleration options to minimize performance trade-offs.
Access Control and Segmentation: Proper role-based access control (RBAC) ensures that only authorized users can configure monitoring settings, preventing unintentional misconfigurations that could degrade performance. Network segmentation further isolates monitoring infrastructure from production systems, enhancing both performance and security.
Compliance-Driven Retention Policies: Regulatory frameworks such as GDPR, HIPAA, or PCI DSS may mandate specific retention or deletion policies for monitoring data. Organizations must align storage optimization strategies with compliance requirements to avoid penalties.
Audit Logging and Monitoring: Continuous audit logging ensures accountability but also generates additional data volume. Balancing audit detail with system performance is essential to maintain compliance without overwhelming the monitoring infrastructure.
Automation and AI-Driven Optimization
Modern AppDynamics deployments can leverage automation and artificial intelligence (AI) to enhance performance optimization and scalability.
Automated Scaling: In dynamic cloud environments, auto-scaling of controller nodes, agents, and storage resources ensures that monitoring capacity adapts automatically to fluctuating workloads.
Policy-Based Optimization: Organizations can implement policies that dynamically adjust sampling rates, instrumentation levels, and data retention periods based on system conditions. For example, during peak traffic, monitoring may shift to more aggregated metrics to reduce load, reverting to detailed monitoring during off-peak hours.
AI-Powered Anomaly Detection: AI and machine learning models built into AppDynamics can detect anomalies in controller performance, network utilization, or storage growth, providing proactive alerts and even automated remediation steps.
Predictive Capacity Planning: AI-driven forecasting models can analyze historical monitoring data to predict future capacity requirements, allowing organizations to scale infrastructure before bottlenecks occur.
Migration Planning and Legacy System Integration
Organizations implementing AppDynamics often need to integrate with existing monitoring solutions or migrate from legacy platforms. Effective migration planning ensures smooth transitions while maintaining operational continuity and leveraging existing monitoring investments.
Legacy system assessment involves evaluating existing monitoring capabilities, identifying integration opportunities, and planning migration strategies. Organizations should catalog existing monitoring tools, analyze overlap with AppDynamics capabilities, and develop migration timelines addressing operational constraints.
Data migration strategies address historical performance data, configuration settings, and custom integrations. Organizations may choose to maintain parallel monitoring systems during transition periods or implement data export and import procedures for critical historical information.
Integration planning considers ongoing coexistence between AppDynamics and existing monitoring tools. Organizations may implement hybrid monitoring approaches where different tools address specific monitoring requirements or maintain legacy systems for specific applications or infrastructure components.
Change management procedures ensure smooth organizational transitions from legacy monitoring approaches to AppDynamics-based workflows. Training programs, documentation updates, and operational procedure modifications support successful technology adoption and utilization.
Advanced Agent Configuration and Instrumentation Techniques
Modern enterprise applications require sophisticated monitoring approaches that extend beyond basic performance metrics to encompass detailed transaction analysis, custom business logic tracking, and comprehensive dependency mapping. Advanced agent configuration techniques enable organizations to extract maximum value from their AppDynamics investments while maintaining optimal system performance.
The instrumentation framework within AppDynamics supports multiple configuration approaches ranging from automatic discovery mechanisms to highly customized monitoring implementations. Automatic instrumentation leverages built-in intelligence to identify common application frameworks, database connections, and external service dependencies without requiring manual configuration. This approach proves particularly valuable during initial deployments where comprehensive application architecture understanding may be limited.
Custom instrumentation enables organizations to monitor specific business logic, proprietary frameworks, and unique application components that may not be automatically detected. The configuration process involves identifying critical code paths, defining measurement points, and establishing data collection parameters that align with organizational monitoring objectives. Custom instrumentation requires careful planning to balance monitoring comprehensiveness with application performance impact.
Business transaction definition represents a crucial aspect of advanced configuration that enables meaningful performance analysis from end-user perspectives. Rather than focusing solely on technical metrics, business transaction monitoring tracks user interactions, complex workflows, and multi-step processes that directly impact customer experiences. Organizations can define custom business transactions based on URL patterns, method invocations, or custom markers within application code.
Transaction snapshots provide detailed visibility into individual transaction executions, enabling rapid root cause analysis when performance issues occur. Snapshot configuration involves defining trigger conditions, data collection scope, and retention policies that enable effective troubleshooting while managing storage requirements. Advanced snapshot configuration can include custom data collection, error condition tracking, and correlation with external system metrics.
Agent node configuration encompasses various parameters that control monitoring behavior, resource utilization, and data collection granularity. Organizations can adjust sampling rates to balance monitoring completeness with system overhead, configure memory allocation parameters to optimize agent performance, and establish network communication settings that accommodate enterprise security requirements.
Custom metric collection enables monitoring of application-specific performance indicators that may not be captured through standard instrumentation. Organizations can implement custom metrics to track business KPIs, monitor proprietary algorithms, or measure application-specific resource utilization patterns. Custom metric implementation requires careful consideration of data types, aggregation methods, and visualization requirements.
Error detection and analysis configuration extends beyond simple exception tracking to encompass business logic errors, data validation failures, and external service integration issues. Advanced error configuration includes defining custom error conditions, establishing error classification schemes, and implementing error correlation mechanisms that enable rapid identification of error patterns and root causes.
Database and Infrastructure Monitoring Optimization
Contemporary enterprise applications rely heavily on database systems and underlying infrastructure components for optimal performance. Comprehensive monitoring of these foundational elements requires specialized configuration approaches that provide deep visibility into database operations, infrastructure resource utilization, and inter-system dependencies.
Database monitoring configuration encompasses multiple dimensions including query performance analysis, connection pool management, deadlock detection, and resource utilization tracking. Organizations must establish monitoring coverage for all database systems supporting critical applications while implementing configuration parameters that minimize monitoring overhead on production database systems.
Query-level monitoring provides granular visibility into individual database operations, enabling identification of poorly performing queries, resource-intensive operations, and optimization opportunities. Configuration options include query execution time thresholds, result set size monitoring, and parameter binding analysis that collectively enable comprehensive database performance optimization.
Connection pooling monitoring addresses one of the most common sources of application performance issues in database-dependent systems. Proper configuration enables tracking of connection pool utilization, connection establishment failures, and pool exhaustion conditions that can severely impact application performance. Organizations can establish proactive alerting based on connection pool metrics to prevent performance degradation.
Infrastructure monitoring encompasses server hardware, virtualization platforms, container orchestration systems, and network infrastructure components. Effective configuration requires understanding of infrastructure architecture, resource allocation patterns, and capacity constraints that may impact application performance.
Server-level monitoring includes CPU utilization tracking, memory consumption analysis, disk I/O performance measurement, and network throughput monitoring. Configuration parameters must balance monitoring granularity with system overhead while ensuring adequate visibility into resource constraints that may impact application performance.
Virtualization monitoring extends infrastructure visibility to include virtual machine resource allocation, hypervisor performance, and resource contention between virtual machines. Organizations operating virtualized environments must configure monitoring to account for resource sharing, overcommitment scenarios, and virtualization-specific performance characteristics.
Container monitoring addresses the unique challenges associated with containerized application deployments including container lifecycle management, resource limits enforcement, and orchestration platform integration. Configuration approaches must accommodate dynamic container creation and destruction while maintaining consistent monitoring coverage across container populations.
Network infrastructure monitoring provides visibility into bandwidth utilization, latency characteristics, packet loss rates, and connectivity issues that may impact application performance. Configuration includes establishing monitoring coverage for critical network paths, implementing threshold-based alerting for network performance degradation, and correlating network metrics with application performance indicators.
Storage system monitoring encompasses disk performance, storage capacity utilization, and I/O patterns that directly impact application responsiveness. Configuration requirements include establishing monitoring for storage subsystems, implementing capacity alerting mechanisms, and correlating storage performance with application behavior patterns.
Business Transaction Analysis and User Experience Monitoring
Understanding how end users interact with applications and measuring the performance of business-critical processes represents fundamental requirements for effective application performance management. Business transaction analysis and user experience monitoring provide essential visibility into customer-facing performance characteristics and business impact metrics.
Business transaction identification involves analyzing application architecture to identify user-facing workflows, critical business processes, and key performance indicators that directly correlate with business outcomes. This analysis requires collaboration between technical teams and business stakeholders to ensure monitoring coverage addresses genuine business requirements rather than purely technical metrics.
Transaction flow mapping creates visual representations of how user requests traverse application infrastructure, interact with various system components, and generate responses. This mapping process enables identification of performance bottlenecks, dependency relationships, and optimization opportunities that may not be apparent through traditional monitoring approaches.
End-user experience measurement encompasses various metrics including page load times, transaction completion rates, error frequencies, and user satisfaction indicators. Configuration of user experience monitoring requires establishing measurement points throughout user interactions, defining acceptable performance thresholds, and implementing correlation mechanisms that connect technical metrics with business outcomes.
Real user monitoring provides visibility into actual user experiences rather than synthetic testing results. This approach captures genuine user behavior patterns, geographic performance variations, and device-specific performance characteristics that significantly impact customer satisfaction. Configuration involves implementing data collection mechanisms that capture user interactions while respecting privacy requirements and regulatory constraints.
Synthetic transaction monitoring complements real user monitoring by providing consistent performance measurement and proactive issue detection. Organizations can configure synthetic transactions that simulate critical user workflows, test application functionality during off-peak hours, and validate performance from various geographic locations.
Geographic performance analysis addresses the global nature of modern applications by monitoring performance characteristics across different regions, network providers, and user populations. Configuration includes establishing monitoring coverage for key geographic markets, implementing region-specific alerting thresholds, and analyzing performance variations that may indicate infrastructure or connectivity issues.
Device and browser compatibility monitoring ensures optimal user experiences across various client platforms, operating systems, and browser implementations. Configuration approaches include defining monitoring coverage for supported platforms, implementing device-specific performance thresholds, and tracking compatibility issues that may impact user adoption.
Mobile application monitoring addresses the unique challenges associated with mobile platforms including network connectivity variations, device resource constraints, and application lifecycle management. Configuration requirements encompass mobile-specific metrics, offline behavior tracking, and integration with mobile development workflows.
Alerting and Notification Strategy Development
Effective alerting strategies ensure appropriate stakeholders receive timely notifications regarding performance issues while minimizing alert fatigue and false positive notifications. Developing comprehensive alerting strategies requires careful consideration of organizational structure, operational procedures, and business impact assessment capabilities.
Alert classification systems organize notifications based on severity levels, business impact assessments, and required response timeframes. Organizations should establish clear classification criteria that enable rapid prioritization of alerts and appropriate resource allocation for issue resolution. Classification schemes typically encompass critical business-impacting issues, warning conditions requiring attention, and informational notifications providing operational awareness.
Escalation procedures ensure critical issues receive appropriate attention when initial notification recipients are unavailable or fail to acknowledge alerts within specified timeframes. Effective escalation configurations include multiple notification channels, time-based escalation rules, and integration with incident management systems commonly used in enterprise operations.
Notification channel configuration encompasses email notifications, SMS messaging, integration with collaboration platforms, and webhook integrations with external systems. Organizations should implement redundant notification channels to ensure critical alerts reach appropriate recipients even during communication system failures.
Alert correlation mechanisms reduce notification volume by identifying related alerts that stem from common root causes. Advanced correlation capabilities can suppress secondary alerts when primary issues are detected, group related notifications into consolidated summaries, and provide context information that accelerates troubleshooting processes.
Threshold management strategies address the challenge of establishing appropriate alert conditions that detect genuine issues while minimizing false positive notifications. Dynamic threshold adjustment capabilities enable automatic modification of alert conditions based on historical performance patterns, seasonal variations, and application behavior changes.
Business hours configuration ensures alert handling procedures accommodate organizational operational schedules, time zone differences, and on-call rotation schedules. Organizations can implement different alerting behaviors during business hours versus off-hours periods, ensuring appropriate response procedures for various operational timeframes.
Alert acknowledgment and resolution tracking provides accountability mechanisms and operational metrics regarding alert handling effectiveness. Configuration includes implementing acknowledgment requirements, resolution timeframe tracking, and post-incident analysis capabilities that support continuous improvement of alerting strategies.
Integration with incident management platforms enables automated ticket creation, workflow triggering, and resolution tracking that align with established organizational procedures. These integrations ensure performance monitoring alerts are properly incorporated into broader operational incident management processes.
Performance Analysis and Trend Identification Techniques
Systematic performance analysis and trend identification enable organizations to proactively address performance degradation, plan capacity requirements, and optimize application performance based on historical patterns and predictive analytics. Effective analysis techniques require comprehensive data collection, appropriate analytical tools, and structured interpretation methodologies.
Baseline establishment represents the foundation for meaningful performance analysis by defining normal operating ranges for various performance metrics. Baseline calculation methods include statistical analysis of historical data, seasonal adjustment algorithms, and machine learning approaches that accommodate natural variation in application behavior patterns.
Trend analysis techniques enable identification of performance degradation patterns, capacity growth requirements, and optimization opportunities that may not be apparent through real-time monitoring alone. Statistical trend analysis can reveal gradual performance degradation, cyclical performance patterns, and correlation between performance metrics and external factors.
Comparative analysis capabilities enable organizations to assess performance differences across application versions, deployment environments, and configuration changes. A/B testing methodologies can quantify the performance impact of application modifications, infrastructure changes, and optimization initiatives.
Correlation analysis identifies relationships between various performance metrics, enabling holistic understanding of application behavior and root cause analysis capabilities. Advanced correlation techniques can reveal dependencies between application performance and external factors including user load patterns, infrastructure resource utilization, and third-party service performance.
Capacity planning analysis utilizes historical performance data and growth projections to forecast future resource requirements and identify potential capacity constraints. Predictive modeling techniques can estimate future performance characteristics based on expected usage growth, feature additions, and infrastructure modifications.
Performance benchmarking establishes quantitative performance standards that enable objective assessment of application performance improvements and degradation. Benchmarking methodologies should account for various factors including user load patterns, data volume characteristics, and environmental conditions that influence performance measurements.
Root cause analysis frameworks provide structured approaches for investigating performance issues and identifying underlying causes. Effective root cause analysis combines automated analysis capabilities with manual investigation procedures, ensuring comprehensive problem resolution and prevention of recurring issues.
Performance optimization identification techniques analyze performance data to recommend specific improvement opportunities. Automated analysis can identify common performance anti-patterns, suggest configuration optimizations, and recommend infrastructure upgrades based on observed performance characteristics.
Integration with DevOps and CI/CD Pipelines
Modern software development practices emphasize continuous integration, automated deployment, and rapid delivery cycles that require monitoring integration throughout development and deployment workflows. Effective integration ensures performance visibility from development through production while supporting automated quality gates and performance regression detection.
Continuous integration pipeline integration enables automated performance testing and monitoring configuration deployment alongside application code changes. Organizations can implement performance regression detection, automated baseline updates, and configuration validation that ensures monitoring capabilities remain synchronized with application modifications.
Deployment automation integration addresses the challenge of maintaining monitoring coverage during automated deployment processes. Integration approaches include automated agent deployment, configuration updates, and monitoring validation that ensures new deployments receive appropriate monitoring instrumentation without manual intervention.
Performance testing integration combines load testing capabilities with production monitoring tools to provide comprehensive performance validation during pre-production testing phases. This integration enables identification of performance issues before production deployment while validating that monitoring configurations accurately capture application behavior under load conditions.
Version control integration ensures monitoring configurations are properly versioned, tracked, and synchronized with application code changes. Configuration management approaches should treat monitoring configurations as code, implementing version control, code review processes, and automated deployment procedures that maintain configuration consistency across environments.
Environment promotion procedures address the challenge of maintaining monitoring consistency across development, testing, and production environments. Automated promotion processes can ensure monitoring configurations are properly migrated between environments while accommodating environment-specific requirements and constraints.
Quality gate implementation utilizes performance monitoring data to automatically validate deployment readiness and prevent performance regressions from reaching production environments. Automated quality gates can compare current performance characteristics with established baselines, requiring manual approval for deployments that exhibit performance degradation.
Rollback capabilities enable rapid restoration of previous application versions when performance monitoring detects significant performance degradation following deployments. Integration with deployment automation tools enables coordinated rollback procedures that restore both application code and associated monitoring configurations.
Security and Compliance Considerations
Enterprise monitoring implementations must address various security and compliance requirements while maintaining comprehensive performance visibility. Effective security implementation ensures monitoring data remains protected while enabling appropriate access for operational teams and compliance reporting requirements.
Authentication and authorization frameworks ensure only authorized personnel can access monitoring data and configuration capabilities. Integration with enterprise identity management systems enables centralized user management, role-based access controls, and audit trail capabilities that support compliance requirements.
Data encryption requirements encompass both data transmission security and storage encryption capabilities. Organizations must implement appropriate encryption standards for monitoring data transmission between agents and controllers while ensuring stored performance data remains protected according to organizational security policies.
Network security configuration addresses firewall requirements, network segmentation policies, and secure communication protocols that protect monitoring infrastructure while enabling necessary data collection and analysis capabilities. Security configuration must balance protection requirements with monitoring functionality to ensure comprehensive performance visibility.
Compliance reporting capabilities enable organizations to generate audit trails, access reports, and compliance documentation required by various regulatory frameworks. Monitoring platforms should provide comprehensive logging capabilities that track user access, configuration changes, and data access patterns required for compliance validation.
Data retention and privacy policies address requirements for performance data storage, personal information protection, and data lifecycle management. Organizations must implement appropriate data retention schedules, anonymization procedures, and data purging capabilities that align with regulatory requirements and organizational policies.
Vulnerability management procedures ensure monitoring infrastructure remains protected against security threats through regular updates, security assessments, and vulnerability remediation processes. Organizations should establish update procedures, security monitoring capabilities, and incident response procedures that address monitoring infrastructure security.
Advanced Reporting and Analytics Capabilities
Comprehensive reporting and analytics capabilities enable organizations to extract maximum value from monitoring investments by providing actionable insights, executive-level summaries, and detailed operational reports that support decision-making processes. Advanced analytics extend beyond basic performance reporting to encompass predictive capabilities and business intelligence integration.
Executive dashboard creation provides high-level performance summaries appropriate for senior leadership audiences. Executive dashboards should focus on business impact metrics, trend summaries, and key performance indicators that directly correlate with organizational objectives rather than detailed technical metrics.
Operational reporting addresses the detailed information requirements of technical teams responsible for application maintenance and optimization. Operational reports should provide comprehensive performance analysis, troubleshooting information, and detailed metrics that support day-to-day operational activities.
Compliance reporting capabilities generate documentation required for regulatory compliance, service level agreement validation, and audit procedures. Compliance reports should provide appropriate detail levels, historical trend analysis, and exception reporting that supports organizational compliance requirements.
Custom analytics development enables organizations to implement specialized analysis capabilities that address unique business requirements or technical constraints. Custom analytics may encompass business-specific performance indicators, proprietary algorithm monitoring, or integration with external business intelligence platforms.
Predictive analytics capabilities utilize historical performance data to forecast future performance characteristics, capacity requirements, and potential performance issues. Machine learning algorithms can identify performance patterns that may indicate future problems, enabling proactive optimization initiatives.
Business intelligence integration enables correlation between application performance metrics and business outcomes, providing insights into the relationship between technical performance and business success. Integration approaches may include data export capabilities, API connections, or direct integration with business intelligence platforms.
Automated report generation and distribution ensures stakeholders receive regular performance updates without manual intervention. Automated reporting should accommodate various audience requirements, delivery schedules, and format preferences while maintaining report accuracy and relevance.
Performance benchmarking reports enable organizations to compare current performance against historical baselines, industry standards, or internal performance targets. Benchmarking reports should provide context information that enables meaningful interpretation of performance comparisons and identification of improvement opportunities.
Conclusion
Preparing for the Cisco AppDynamics Associate Administrator Certification is not just about passing an exam—it is about gaining the confidence and technical know-how to manage, optimize, and troubleshoot application performance in real-world environments. The certification serves as a powerful steppingstone for IT professionals who want to expand their expertise in application performance monitoring (APM) and observability, while also demonstrating their ability to work with enterprise-grade monitoring solutions.
The preparation journey requires a structured approach. It begins with developing a solid understanding of AppDynamics architecture, agents, and controllers, and extends into mastering dashboards, health rules, alerts, and end-to-end transaction monitoring. Candidates who take the time to immerse themselves in hands-on practice will not only retain knowledge better but will also be able to apply it effectively in business-critical scenarios. In addition, familiarity with real-world case studies and lab exercises enhances the ability to identify bottlenecks, resolve performance issues, and ensure consistent application uptime—skills that organizations highly value.
Optimizing AppDynamics performance and scalability is a continuous process that requires careful attention to hardware, software, network, and storage layers. By proactively tuning controllers, fine-tuning agents, and implementing efficient network and storage strategies, organizations can ensure that their monitoring infrastructure keeps pace with business growth. Equally important is embedding security and compliance into every optimization decision, ensuring monitoring operations remain both resilient and trustworthy.
The adoption of automation and AI-driven optimization strategies further enhances efficiency, enabling organizations to dynamically adapt to changing workloads without manual intervention. These approaches not only reduce administrative overhead but also minimize the risk of human error, creating a self-healing, self-scaling monitoring ecosystem.
Equally important is balancing theoretical study with practical experience. While the official study resources, Cisco’s documentation, and training modules provide the foundation, nothing can replace hands-on configuration and troubleshooting practice within a live or simulated environment. Leveraging practice tests, community forums, and study groups can further deepen understanding, highlight weak areas, and boost confidence ahead of the exam.
Beyond technical readiness, earning this certification reflects a mindset of continuous learning. In today’s digital-first world, where applications drive business outcomes, professionals who understand how to proactively monitor and improve application performance stand out. The certification validates not just technical competence but also the ability to align IT performance with business goals—a critical differentiator in modern organizations.
Ultimately, the Cisco AppDynamics Associate Administrator Certification equips professionals with the skills to ensure applications run smoothly, efficiently, and reliably. For individuals, it opens career growth opportunities and positions them as valuable assets in any IT team. For organizations, it ensures that their workforce can effectively leverage AppDynamics to deliver optimal user experiences and maintain high availability. By dedicating time, focus, and consistent practice, candidates can transform exam preparation into a rewarding career advancement opportunity.
Frequently Asked Questions
Where can I download my products after I have completed the purchase?
Your products are available immediately after you have made the payment. You can download them from your Member's Area. Right after your purchase has been confirmed, the website will transfer you to Member's Area. All you will have to do is login and download the products you have purchased to your computer.
How long will my product be valid?
All Testking products are valid for 90 days from the date of purchase. These 90 days also cover updates that may come in during this time. This includes new questions, updates and changes by our editing team and more. These updates will be automatically downloaded to computer to make sure that you get the most updated version of your exam preparation materials.
How can I renew my products after the expiry date? Or do I need to purchase it again?
When your product expires after the 90 days, you don't need to purchase it again. Instead, you should head to your Member's Area, where there is an option of renewing your products with a 30% discount.
Please keep in mind that you need to renew your product to continue using it after the expiry date.
How often do you update the questions?
Testking strives to provide you with the latest questions in every exam pool. Therefore, updates in our exams/questions will depend on the changes provided by original vendors. We update our products as soon as we know of the change introduced, and have it confirmed by our team of experts.
How many computers I can download Testking software on?
You can download your Testking products on the maximum number of 2 (two) computers/devices. To use the software on more than 2 machines, you need to purchase an additional subscription which can be easily done on the website. Please email support@testking.com if you need to use more than 5 (five) computers.
What operating systems are supported by your Testing Engine software?
Our testing engine is supported by all modern Windows editions, Android and iPhone/iPad versions. Mac and IOS versions of the software are now being developed. Please stay tuned for updates if you're interested in Mac and IOS versions of Testking software.